
Acquisition Telecom Cleanup: Inventorying Circuits After a Merger
By Sharon Watkins, Founder and CEO, RadiusPoint · 15 September 2026
Acquisition telecom cleanup starts by inventorying every BAN and circuit from both companies, then clearing duplicates before you renegotiate carriers or redesign networks. Day-one rate bake-offs feel productive. Without a census, they lock in blind spots from both estates.
Post-merger telecom cleanup is a BAN and circuit census first, then duplicate clearing, disconnect decisions, credit pursuit, and GL merge. RadiusPoint loads acquired inventories into ExpenseLogic so the combined company runs one multi-carrier audit estate instead of two competing spreadsheets.
Key Takeaways
- Day-one priority is a complete BAN and circuit census, not an early rate bake-off.
- Merged estates hide duplicate circuits, dual BANs at one site, and contracts mid-notice-window.
- Cleanup savings are only credible when disconnects and credits map to inventory IDs finance can audit.
- MACD freezes and LOA scope updates prevent ordering chaos during integration.
- RadiusPoint consolidates acquired telecom inventories into ExpenseLogic for one multi-carrier audit estate.
The Short Version
- Census BANs and circuits from both entities (CSRs, BAN lists, contracts).
- Flag duplicates and dual BANs per site.
- Decide retain or disconnect with an owner.
- Pursue credits for erroneous charges.
- Merge GL coding into one model on ExpenseLogic.
That Merger Telecom Cleanup Sequence is the playbook Controllers will fund because each step leaves an inventory ID they can sample.
Day-one census before any carrier meeting
Before carrier meetings, pull CSRs and BAN lists from both entities so ExpenseLogic starts with a full circuit census rather than a partial rumor inventory. Renegotiation without inventory truth recreates the acquiree’s blind spots under a new logo.
Start the census in diligence when possible. Otherwise start in week one of integration. Capture carrier, BAN, service ID, site, contract end, notice window, and interim owner for every row. RadiusPoint treats that file as the first onboarding artifact for the combined estate, aligned with the same discipline as TEM onboarding data.
Wireless devices of acquired employees need a parallel pass: HR roster reconciliation and line inventory beside wireline circuits. Wireline cleanup alone leaves mobility spend billing for badges that already closed.
Duplicate circuits and dual BANs after legal day one
After close, expect dual BANs at shared sites and overlapping circuits that both entities ordered for the same building or backup path. Legal day one does not delete either company’s last three years of MACD habits.
Use a Dual-BAN Site Card per location during integration:
| Field | What integration captures |
|---|---|
| Site / building | Canonical location name and code |
| BANs present | Every Billing Account Number still billing the site |
| Circuits / service IDs | Active paths, including backup and temporary builds |
| Contract ends / notice windows | Dates that can silently renew during integration |
| Owner | Named telecom and business owner post-close |
| Retain / disconnect draft | Decision pending evidence, not a hallway guess |
Duplicate discovery is an audit job with inventory keys, not a network redesign slide. Telecom audit services should flag dual billing and dead paths before anyone promises synergy dollars.
Contract notice windows inside the integration calendar
Put acquired contract notice windows on the integration calendar immediately so silent renewals do not lock rates while teams are busy on network redesign. Integration calendars already track HR, real estate, and systems. Telecom notice windows belong there too.
A contract mid-window during a merger is a finance risk disguised as an IT backlog item. Miss the window and you inherit term length you did not choose while duplicate circuits still bill. Demand and capacity planning for the combined estate should include those dates; RadiusPoint’s material on demand planning and forecasting is adjacent to that calendar discipline even when the immediate job is cleanup, not growth.
LOAs usually need re-papering for acquired BANs. Scope ordering rights carefully so integration vendors cannot place blanket orders while MACD should be frozen or tightly approved.
Cleanup sequence that finance will fund
Sequence cleanup as inventory validate, duplicate flag, disconnect or retain decision, dispute credits, then GL coding merge so Controllers see controlled savings. Skipping to carrier consolidation without that sequence recreates blind spots faster than it removes them.
Cleanup savings are credible only when disconnects and credits map to inventory IDs. Inventory management on RadiusPoint’s published record recovered $174,000 in re-credits when inventory truth drove pursuit. A client growth path from 170 to 1,200 locations on the published record shows why a single estate matters after scale events; a merger is a scale event with worse starting data quality.
Telecom refund recovery belongs after the retain or disconnect decision, not before. Filing disputes on circuits you still have not classified wastes carrier windows and Controllers patience.
How RadiusPoint stabilizes post-merger TEM on ExpenseLogic
RadiusPoint loads both estates into ExpenseLogic, reconciles multi-carrier BANs, and runs MACD under client approvals until one telecom inventory of record remains. Software plus people is the stabilizer: the platform holds one schema; analysts work dual BANs, regional carriers, and credit pursuit while integration teams redesign networks.
Practical controls during the transition:
- MACD freeze or heightened approval on acquired BANs until owners are named.
- One exception queue across both legacy estates.
- Scoped LOAs for acquired accounts.
- GL coding map that Controllers approve before the first combined close.
Preserve inventory deliberately when tools change mid-integration. Losing service IDs while switching platforms is how mergers pay for the same circuit twice under a new vendor login. Treat the move like a controlled inventory handoff, not a cutover party.
Cleanup is done when one inventory of record, one exception queue, and one GL coding model cover the combined estate. Until then, you still have two companies’ telecom problems sharing a letterhead.
Integration leads often ask for a single carrier meeting in week two to “show progress.” Bring the Dual-BAN Site Cards instead. Carriers will optimise what you still cannot name. RadiusPoint’s posture in ExpenseLogic is to refuse a bake-off narrative until the census rows are complete enough for Controllers to sample.
Closed-location billing on the utility side is a useful analogy only: inventory status should stop charges AP would otherwise pay. On telecom, the parallel is dead circuits and dual BANs after legal day one. Do not import utility dollar figures into a telecom synergy slide. Import the control idea: status before remittance.
Post-Close Controls That Keep the Cleanup From Slipping
The weeks right after close are when discipline pays off, because that’s when accountability is easiest to lose. Roles are shifting, two teams are learning each other’s systems, and the acquired estate has no clear owner yet. So the first control we put in place is a single named owner for the combined inventory, with a short weekly checkpoint where every open disconnect, credit and contract action gets a status. It’s low effort, and it stops work from stalling in the handoff between two organizations that don’t yet share a process.
Evidence is the second control. Every entry in the combined inventory needs to trace back to a source: a carrier record for the service, a signed agreement for the rate, and a work order for anything that changed. When an entry can’t be sourced, it gets flagged rather than assumed, because an unverified line is exactly where a duplicate or a phantom charge hides. Holding to that standard turns the inventory from a best guess into something finance and the carriers will both accept when a dispute comes up.
Carrier coordination is where the two estates actually merge in the outside world. Each carrier has its own process for consolidating accounts, transferring responsibility to the surviving entity, and closing services, and those processes move at different speeds. We sequence the requests so dependent actions don’t collide, confirm each one in writing, and hold a service active until its replacement is verified live. That last rule matters most at shared sites, where cutting the wrong connection takes people offline.
None of this holds without an audit trail. Every disconnect order, credit filing and account change carries a date, a reference number and a confirmation, kept together so the history is reconstructable months later. That record is what protects the recoverable dollars: a credit filed inside the carrier’s dispute window only stays recoverable if you can show when it was raised and what it was raised against. The audit trail is also what an acquirer’s finance team leans on when they need to prove the cleanup actually happened.
Credits and the general ledger handoff close the loop. As disputes resolve, the credits post against the accounts they came from, so the savings show up where the spend lives rather than as a lump nobody can trace. In parallel, the two companies’ coding gets reconciled into one scheme, so combined reporting reads cleanly from the first full month it runs. In ExpenseLogic, that unified coding is what lets RadiusPoint hand finance a combined view instead of two files they have to stitch together.
- Name one owner for the combined inventory and hold a short weekly status on open actions.
- Require a carrier record, a contract and a work order behind every inventory line, and flag anything unsourced.
- Confirm every carrier action in writing and keep a service live until its replacement is verified.
- Post credits against their originating accounts and merge GL coding before the first combined report.
Frequently Asked Questions
How soon after close should TEM cleanup start?
Start the census in diligence if possible. Otherwise start in week one of integration. Carrier meetings can wait until BANs and circuits from both entities sit in one list.
Should we pick one carrier immediately?
Not before inventory truth. Early consolidation without a census locks in duplicate paths and orphan BANs under a preferred logo.
What about wireless devices of acquired employees?
Run HR roster reconciliation and line inventory in parallel with wireline circuit cleanup. Ex-employee and duplicate lines are merger leakage with a different invoice layout.
Do LOAs need re-papering?
Usually yes for acquired BANs. Update Letter of Agency scope so ordering rights stay limited during integration and MACD stays under named approvals.
When is cleanup done?
When one inventory of record, one exception queue, and one GL coding model cover the combined estate in ExpenseLogic, and Controllers can sample disconnects and credits by service ID.
Census First, Synergy Second
Acquisition telecom cleanup rewards teams that inventory before they renegotiate. RadiusPoint consolidates both estates in ExpenseLogic so duplicate circuits, dual BANs, and notice windows become managed work instead of integration folklore.
Request a post-merger BAN census load into ExpenseLogic and ask to walk five Dual-BAN Site Cards from discovery to retain or disconnect to credit to GL impact.
This article is educational. RadiusPoint does not guarantee synergy percentages, cleanup timelines, or carrier outcomes. Published figures cited are specific client outcomes and were current as of 15 September 2026.
Facility Utility Bill Pay vs Utility Expense Management: Where Audit Starts
By Sharon Watkins, Founder and CEO, RadiusPoint
Utility bill pay clears invoices by their due date. Utility Expense Management, UEM after this first use, starts earlier. It audits the meter inventory, the tariff, and each site’s open or closed status before any funds move. Bill pay answers “did we pay on time.” UEM answers “should we have paid this at all, and at this rate.”
Here’s the tension that quietly drains a facilities budget. An accounts payable team can hit every due date, dodge every late fee, and still remit thousands of dollars a month for electricity, gas, and water at buildings nobody occupies. The invoices were paid correctly. They should never have reached payment. At RadiusPoint, one multi-location client was paying roughly $1,500 a month, about $18,000 a year, in utilities at closed locations that bill pay alone had no reason to question.
If you’re a Facilities Manager, Real Estate leader, Controller, or CFO deciding what to buy or build, the distinction below decides whether spend gets validated or just settled.
Key Takeaways
The core takeaway: bill pay clears invoices by due date, while UEM validates meter inventory, tariff, and site status before any funds move.
- Bill pay optimizes for timeliness. UEM optimizes for meter and tariff correctness. Paying on time is not the same as paying the right amount.
- A UEM audit starts with meter inventory and site status, not with remittance. The first question is what should be billed, not what is due.
- Vacant and closed sites leak cash under bill pay alone, because a paid-on-time invoice for an empty building still clears.
- RadiusPoint runs UEM on ExpenseLogic across electricity, gas, water, sewer, and waste, with meter-level controls and vacant cost recovery built in.
Utility Bill Pay Goals vs UEM Goals: Timeliness vs Correctness
Bill pay aims to avoid late fees and keep service running, while UEM aims to pay only validated, meter-level charges billed at the correct tariff.
Bill pay is measured on cycle time and clean remittance: received, coded, approved, and paid before the disconnect date. Every one of those steps assumes the charge is legitimate. Bill pay has no mechanism to ask whether the meter behind the account still serves an active site, or whether the rate matches what the account qualifies for.
UEM inverts the order. Before it clears anything, it validates the charge against a record of what should exist: which meters, at which sites, on which tariff, within which consumption range. When a building goes dark, UEM flags the still-arriving invoice and triggers vacant utility cost recovery rather than routing it to payment like any other bill.
| Question it answers | Utility bill pay | Utility Expense Management |
|---|---|---|
| Is this invoice due soon? | Yes, this is the core job | Yes, but only after validation |
| Does this meter serve an active site? | No visibility | Checked against site status |
| Is this the correct tariff class? | No visibility | Audited against rate rules |
| Is consumption within a normal range? | No visibility | Threshold-tested per meter |
| Primary risk it removes | Late fees, service interruption | Overpayment, phantom spend, wrong rate |
Where the Audit Starts in a UEM Program
A UEM audit starts before payment with a meter inventory, a tariff class check, consumption thresholds, and each site’s open or closed status.
Remittance is the last step, not the first. Bill pay begins at the invoice and ends at the payment. UEM begins several steps upstream, at the reference data that tells you whether the invoice deserves to be paid. That reference data is a meter-level inventory, not an account list, because a single account can span multiple meters and a single site can carry meters that were never decommissioned. Auditing at account level is how closed-site charges survive. Auditing at meter level is how they get caught.
| Step | Question asked | Bill pay does this? |
|---|---|---|
| 1. Due date | When must this be paid to avoid a fee or disconnect? | Yes, first and only |
| 2. Meter inventory | Which meters exist, at which sites, tied to which accounts? | No |
| 3. Tariff validation | Is the account on the correct rate class for its usage and location? | No |
| 4. Site status | Is this location open, vacant, or closed as of this billing period? | No |
A bill pay process runs step one and skips to payment. A UEM process runs steps two through four first. Tariff validation is where a surprising share of recoverable money sits, because a wrong rate class bills quietly and consistently for years. When usage or site type no longer matches the assigned rate, that’s a utility rate reclassification finding, and it belongs to the audit, not to accounts payable.
Utility Bill Pay vs UEM: The Operating Model Side by Side
Side by side, bill pay and UEM differ in who owns them, what data keys they use, which exceptions they raise, and what they report.
Bill pay and UEM look identical at the moment of payment, because the invoice gets paid either way. The divergence lives in everything before and after that payment, which the table below lays out.
| Dimension | Utility bill pay | Utility Expense Management |
|---|---|---|
| Owner | Accounts payable, treasury | Facilities, real estate, and finance, coordinated |
| Data key | Vendor account number | Meter number tied to site and cost center |
| Trigger | Invoice arrives | Invoice arrives and inventory is checked |
| Exception type | Payment failed or is overdue | Wrong tariff, off-threshold usage, charge at a closed site |
| Action on exception | Chase the payment | Dispute the charge, file for a credit, correct the rate |
| Reporting output | Paid versus outstanding | Cost by site and meter, recovery filed versus credited, tariff variance |
The data key row drives everything else. Bill pay is organized around the vendor account. UEM is organized around the meter, mapped to a site and a cost center. That single choice is what lets UEM allocate spend accurately, benchmark one location against another, and detect a charge at a site that closed last quarter. Fixing exceptions rather than settling invoices is why UEM sits closer to the discipline described in our overview of invoice auditing services than to a payment queue.
Vacant and Closed Sites: The Proving Ground for UEM
Vacant and closed sites prove whether you manage expenses or only pay bills, because site status should stop charges accounts payable would otherwise remit.
When a location closes or a tenant moves out, the meters rarely stop with them. The account stays open, the utility keeps billing, and unless someone has connected site status to the payment process, the invoices keep clearing. They arrive on schedule, for a plausible amount, against a real account, and they pay on time for a building that’s empty.
This is exactly where the RadiusPoint closed-location figure comes from: roughly $1,500 a month, about $18,000 a year, for one multi-location client, paid out on utilities at sites no longer in use. Under bill pay alone, that spend is invisible. Under UEM, the vacant or closed status flags the meter, the charge routes to an exception instead of to payment, and recovery begins. Across a property portfolio, chasing exactly this pattern is how vacant cost recovery has decreased utility expenses by 12 percent.
A late invoice gets noticed within days. A perfectly paid invoice for an empty building can bill for years. Only UEM is looking for the second one.
How RadiusPoint Runs UEM on ExpenseLogic
RadiusPoint validates utility invoices at meter level inside ExpenseLogic, allocates each cost to the right site, and recovers spend that tenant transitions leave behind.
The platform holds the inventory and people work the exceptions. ExpenseLogic is the record of what should be billed: the meters, the sites, the tariffs, and the consumption thresholds each account is measured against. Every incoming utility invoice for electricity, gas, water, sewer, and waste is validated line by line against that record, then allocated down to location, department, and meter number. When a charge fails the tariff check, breaks a threshold, or hits a meter at a closed site, ExpenseLogic raises the exception.
The other half is the part most platforms leave to the client. A RadiusPoint analyst takes the exception, files the dispute with the provider, pursues the credit, and, in the vacant case, works the account back to closure so the leak stops rather than just gets reported. Software plus people is the model.
Verdict: if your first question is the due date, you’re buying bill pay. If your first question is the meter inventory and the tariff, you’re buying UEM. Both keep the lights on. Only one keeps you from paying for lights in a building that’s dark.
The practical move for most portfolios isn’t to abandon bill pay. It’s to put a UEM audit layer in front of it, so validation happens before funds move. If you also manage telecom or wireless spend and want the same allocation and close pattern across categories, the case for a managed provider is laid out in our guide to when you need TEM. RadiusPoint delivers that layer on ExpenseLogic, and it starts at the meter, not the due date.
Frequently Asked Questions
These answers clarify what UEM means here, whether AP automation suffices, how deregulation and rate reclassification apply, and whether TEM and UEM belong together.
Is UEM Unified Endpoint Management?
No. In this article UEM means Utility Expense Management. Unified Endpoint Management is an unrelated IT term for managing devices. Here, UEM is the discipline of auditing, allocating, and controlling utility spend across electricity, gas, water, sewer, and waste.
Can AP automation alone deliver UEM?
It can pay, but it can’t audit. Accounts payable automation processes and remits invoices efficiently, which is bill pay done well. Meter and tariff audit still need UEM inventory and rules, because AP automation has no record of which meters should exist or what rate each account qualifies for.
Do we need deregulated procurement to start UEM?
No. Audit and allocation create value in regulated markets too. Procurement and rate shopping depend on deregulation, but validating meters, catching wrong tariff classes, allocating cost by site, and recovering charges at closed locations work regardless of market structure.
How does rate reclassification fit?
Wrong tariff classes are a UEM audit finding, not a bill pay task. When an account’s assigned rate no longer matches its usage or site type, the charge bills quietly and correctly from the provider’s side. Only a meter-level audit that validates tariff against the account catches it and files for the correction.
Should TEM and UEM share a platform?
Sharing ExpenseLogic gives Controllers one allocation and close pattern across categories. Telecom, wireless, and utility spend then validate, allocate, and report the same way, on one meter-and-account-keyed record, instead of living in separate tools with separate exception handling and separate month-end routines.
How to Prove TEM Savings to Finance Without Inflating Avoidance Dollars
By Sharon Watkins, Founder and CEO, RadiusPoint
Prove TEM savings with hard refunds, documented rate cuts on live services, and eliminated inventory, while labeling avoidance separately so finance never sees inflated totals. The reason this matters is simple. A Controller has sat through too many savings decks that fall apart on the second question. A headline number lands, someone asks how it was calculated, and half of it turns out to be avoidance annualized on optimistic assumptions. Once that happens, every future number your telecom expense management programme reports gets quietly discounted.
Key Takeaways
This is the entire method in one place: separate the three buckets, evidence every line, label avoidance honestly, and hand audit a re-performable ledger.
- Hard savings are cash refunds and permanent bill reductions tied to a BAN and an invoice period.
- Avoidance is real but different, because it’s spend prevented, not cash hitting the ledger.
- Inflated avoidance, the habit of counting every hypothetical, destroys credibility with Controllers faster than a missed number ever will.
- Evidence packs need before and after rates, inventory IDs, carrier credit memos, and GL impact.
- RadiusPoint structures savings reporting from ExpenseLogic audit work so finance can re-perform the logic without a meeting.
Hard savings versus avoidance versus soft claims
Hard savings change cash or recurring bills, avoidance prevents spend, and soft claims without BAN-level evidence do not belong in a finance packet.
The difference isn’t academic. It decides which line a Controller will defend to an auditor and which line gets struck before the report leaves the building. Sort every claimed saving into one of three buckets. We call it the Three-Bucket Savings Model, and it’s the first thing that goes on any RadiusPoint savings report.
| Bucket | What it is | Evidence it needs | How it hits finance |
|---|---|---|---|
| Hard savings | Cash refunds and credits, plus a bill you were paying that permanently drops, such as a disconnected service that stops billing | Carrier credit memo, or the before and after invoice on the same BAN and service ID | Real money: cash returned, or a lower recurring invoice from now on |
| Negotiated recurring savings | A contracted or optimised rate that lowers a live, still-billed service every cycle | Signed rate exhibit tied to the service ID, showing the old rate and the new rate | Lower recurring cost for as long as the service stays active at the new rate |
| Avoidance | Spend you prevented that never reached an invoice, such as an order you stopped or a plan you right-sized before it billed | A dated decision with the quantified basis behind it | Budget protected, but no cash moves and no invoice drops |
Soft claims are everything else: productivity, hours saved, general efficiency. They can be true and still not belong in the savings total, because finance can’t reconcile them to a BAN. Put them in the narrative, not the number. The cleanest hard-savings line is a recovered credit, which is the core of telecom refund recovery, and it’s also the line auditors accept most easily, because a credit memo is a document a carrier issued, not a calculation you performed.
Where programmes inflate numbers and how to stop
Inflation happens when one-time credits are annualized forever, baseline rates are fictional, or disconnected services get double-counted as both a refund and ongoing avoidance.
None of these require dishonesty. They usually come from a spreadsheet that was built to look impressive rather than to survive review. Each has a fix, and the fix is always the same shape: anchor the number to evidence and count it once.
| Anti-pattern | Why it inflates | The fix |
|---|---|---|
| Annualizing a one-time credit forever | A large refund is year-one cash, not a recurring saving. Carrying it into year two and three invents money that never returns | Book one-time credits once, in the period they post. Only recurring rate and inventory changes carry forward |
| Fictional baselines | Claiming a percentage saved against a list price you never actually paid | Baseline against the contracted or previously billed rate on the same service ID |
| Double-counting a disconnect | Claiming the refund for past overbilling and also claiming ongoing avoidance on the same dead service | Count the credit as hard savings once, then count the stopped recurring charge as a recurring reduction, never both, and never a third time as avoidance |
| Counting every hypothetical | Treating every plan you could theoretically change as avoidance already banked | Only count avoidance tied to a real, dated decision that actually happened |
The common root is missing evidence. A disciplined line-item telecom audit is what produces the credit memos, rate exhibits, and disconnect confirmations that keep each number anchored to something a carrier or a contract can confirm. Without that evidence, a programme is left estimating, and estimates drift upward until the first hard question exposes them.
Evidence Controllers accept
Controllers accept credit memos, rate exhibits tied to service IDs, disconnect confirmations, and GL postings that reconcile cleanly to the savings story you are telling.
Everything else is a claim awaiting proof, and a Controller will treat it that way. The evidence pack behind a defensible savings report is short and specific:
- Carrier credit memos with case numbers, matched to the BAN and to the invoice that carried the credit.
- Before and after invoices on the same service ID, comparing like periods, so a rate change is visible rather than asserted.
- Signed rate exhibits or contract amendments showing the old rate and the new rate.
- Disconnect confirmations from the carrier, not just the internal disconnect order, since an order raised is not a service removed.
- GL postings that show the credit or the reduced charge landing in the correct cost center and period.
- The inventory of record, dated, showing the service removed from what you own.
This is why credible savings reporting is a byproduct of a real invoice auditing service, not a quarter-end spreadsheet exercise. The audit generates the documents. The report only has to organise them and point each one at the line it supports.
A savings ledger finance can re-perform
Keep a ledger carrying BAN, service ID, savings type, monthly impact, start date, and owner, so audit can re-perform each line without a slide deck.
Internal Audit should pick any row, pull evidence, redo the arithmetic, and reach the same number. The Re-Performable Ledger uses these fields:
| Field | What it holds | Why audit needs it |
|---|---|---|
| BAN | The billing account number the saving sits under | Ties the line to a real, billable account |
| Service ID | The specific circuit, line, or service affected | Prevents double-counting across overlapping claims |
| Savings type | Hard, negotiated recurring, or avoidance | Keeps the three buckets from blending into one total |
| Monthly and one-time impact | Recurring dollars per month, and any one-time credit held separately | Stops a one-time refund from being annualized |
| Baseline reference | The contracted or previously billed rate used | Kills fictional baselines |
| Start date and end condition | When it began, and what stops it counting | A rate reduction stops when the service disconnects or the contract changes |
| Evidence link and owner | The credit memo or exhibit, and the named person accountable | Makes the line re-performable and someone answerable for it |
How RadiusPoint reports savings from ExpenseLogic work
RadiusPoint ties refund recovery and optimisation outcomes to inventory and invoices inside ExpenseLogic, so every reported saving stays traceable when finance reviews it.
ExpenseLogic holds inventory, rate tables, and invoice history together, while RadiusPoint analysts pursue carrier disputes, track credits, and update moves, adds, changes, and disconnects. That combination lets a Controller trace each saving to a BAN and period.
Published client outcomes illustrate the rule, not a guarantee. One Fortune 100 manufacturer recovered $450,000 in first-year telecom refunds and moved to $850,000 in ongoing annual savings. The refund is one-time hard savings; the $850,000 carries forward only while rates remain lower. A client also achieved $120,000 a year through contract rate optimisation, a negotiated recurring line. Other reported outcomes include a healthcare provider’s 26% telecom expense reduction and a food service company’s 22% wireless reduction after mobility auditing. Each must be labeled by bucket.
Frequently Asked Questions
These are the questions finance and Internal Audit ask most about a TEM savings report, answered the way a Controller would want them answered.
Should avoidance appear in the same total as hard savings?
No. Show both, labeled separately, and never blend them into one headline number without a footnote that says which part is cash and which part is prevented spend. The moment they merge, the whole figure inherits the credibility of its weakest line.
How long can a rate reduction count?
Count a rate reduction for as long as the service stays active at the new rate. Stop counting it the moment the service disconnects or the contract changes again. A saving on a service that no longer exists is not a saving.
What baseline should we use?
Use the contracted or previously billed rate on the same service ID. Don’t baseline against a market rate or a list price you never actually paid, because that manufactures savings no invoice ever reflected.
Do category benchmarks like typical year-one TEM reductions help?
Only as context, and only with attribution. Organisations implementing telecom expense management often see 15% to 30% first-year reductions, but that’s a Gartner figure about the category in general, not a RadiusPoint guarantee. Present it as background, never as your own projected result.
Who signs the savings report?
Telecom, or the TEM programme owner, prepares it. Finance validates the material lines against the evidence. Internal Audit may sample. Shared ownership across those three roles is what makes the number credible, because no single party both produces and blesses it.
The short version for finance
Report hard and negotiated recurring savings as your headline, keep avoidance labeled and footnoted, and hand audit a ledger it can re-perform without you.
That discipline is the difference between a number finance defends and one it discounts. Re-sort last quarter’s report into three buckets. Anything without a BAN, service ID, and carrier evidence belongs in a footnote until supported. That is the work RadiusPoint does through ExpenseLogic.
What ExpenseLogic Tracks That Spreadsheet TEM Cannot
By Sharon Watkins, Founder and CEO, RadiusPoint
A spreadsheet can track what you spent on telecom, but it can’t hold the evidence that proves each charge, records every change, and survives an audit. ExpenseLogic tracks the things a file structurally cannot: MACD ticket history, contract and invoice images, customer service record extracts, dispute packets, and versioned general ledger files, all tied to the billing account number they belong to. That difference is invisible at small scale and decisive the moment a telecom estate grows.
If you’re running telecom expense management in a spreadsheet, you built the right tool for the size you started at. A single owner, a few accounts, one carrier, and a monthly check against last month’s totals is a reasonable system, and for a while it works. The gap doesn’t appear because anyone did the job badly. It appears because the estate outgrew what any file was designed to hold, and the first place it shows up is the evidence you can’t retrieve when someone asks for it.
Key Takeaways
- A spreadsheet tracks totals well and evidence poorly. It records what you paid, not the proof, history, and documents that justify each charge at audit.
- Growth breaks the file through concurrency and evidence before it breaks the arithmetic: multiple editors, MACD volume, contract images, dispute packets, and versioned GL files that one spreadsheet can’t hold together.
- ExpenseLogic keeps inventory, contract, MACD ticket, invoice line, and GL code linked as one record, so every change traces from the asset to the invoice to the general ledger.
- RadiusPoint isn’t handing you a file to maintain. Its staff work the invoices, disputes, and MACD tickets inside ExpenseLogic on your behalf.
What spreadsheet TEM actually tracks well
Spreadsheets work for small BAN counts and single owners until concurrency and audit evidence outgrow the file. A billing account number (BAN) or two, one carrier, and one person who knows where everything lives is a system a spreadsheet handles cleanly. It records totals, compares this month to last, and splits a handful of cost centers without much friction. The useful question is when you need TEM, tied to change and evidence.
Tracking gaps after first growth spurt
After growth, spreadsheets lose MACD history, contract images, dispute packets, and versioned GL files needed at month-end close. Each gap is a different kind of missing evidence. MACD history, the record of moves, adds, changes, and disconnects, tells you what changed and who approved it, and a spreadsheet overwrites that with every edit. Contract images, including the letter of agency and negotiated terms, live in someone’s inbox rather than beside the charge they govern. A dispute packet, the bundle of invoice image, customer service record, and notes you send a carrier to win a credit, has nowhere to sit. And the general ledger file that finance needs at month-end close exists in five slightly different saved versions, none of them clearly the current one.
The breaking point is usually concurrency, not size. When more than one person needs the record, the single file stops being a source of truth and becomes a set of conflicting copies. Here’s a short checklist for spotting the breaking point:
- More than one person needs to edit the record in the same week.
- You manage more than a small handful of BANs, or more than one carrier.
- MACD activity happens faster than you can log it.
- Finance asks for the same GL allocation two different ways at close.
- An auditor, or your own CFO, asks for the invoice image or dispute proof behind a line.
- You can’t answer “what changed since last month, and who approved it” from the file itself.
If two or more of those are already true, the spreadsheet has passed its concurrency breaking point, and the cost is no longer convenience. It’s the evidence you can’t produce on demand.
Inventory, contract, and ticket history in one record
ExpenseLogic ties inventory to contracts and MACD tickets so every change leaves a trail spreadsheets cannot guarantee. In ExpenseLogic, RadiusPoint’s platform, a service isn’t a row. It’s a linked record that runs from the inventory of the asset, to the contract that sets its rate, to the MACD ticket that last changed it, to the invoice line that bills it, to the GL code that allocates it. That chain is the whole point, because it lets you trace a single charge backward to the change that created it and forward to the budget it lands in.
| Link in the record | What it answers | What a spreadsheet holds instead |
|---|---|---|
| Inventory (asset or service) | What exists, where, and under whose Employee ID | A row that may already be out of date |
| Contract | The rate this asset should bill at | A document in someone’s inbox |
| MACD ticket | What changed, when, and who approved it | Usually nothing at all |
| Invoice line | What the carrier actually billed | The number you keyed by hand |
| GL code | Where the cost is allocated | A formula that breaks on edit |
Because every link is stored together, ExpenseLogic can answer a question a spreadsheet can only guess at: is this charge valid, given the contract, the inventory, and the last approved change? RadiusPoint uses that same chain to catch a rate that reverted at renewal, a circuit that kept billing after a disconnect ticket, and a line still assigned to an employee who left, because each of those shows up as a break between two links that should agree.
Audit evidence and document recall
Line-item audit needs invoice images, CSR extracts, and dispute notes retrievable by BAN and period. A real audit doesn’t compare totals. It compares each line to the contracted rate and to the customer service record (CSR) extract that shows what the carrier has on file, and when it finds a discrepancy, it assembles the invoice image and the dispute note into a packet the carrier will act on. All of that has to be recallable by billing account number and billing period, months later, when the credit is still working its way through. A spreadsheet stores the number and throws away the proof. ExpenseLogic stores the proof, which is what makes line-item invoice auditing repeatable rather than heroic.
One RadiusPoint client had been paying roughly $18,000 a year for toll-free numbers that no longer routed anywhere. The charge repeated on the invoice for years, so a month-to-month spreadsheet never questioned it. Recovering it took retrieving the invoice image and the inventory record together and asking whether those numbers still did anything. They didn’t, and the only reason anyone could prove it was that the documents were still there to pull.
How RadiusPoint uses ExpenseLogic beyond a tool licence
RadiusPoint staff work invoices, disputes, and tickets inside ExpenseLogic. That’s the difference between buying a platform and buying an outcome. RadiusPoint does that work for you inside ExpenseLogic: validating every line against the contract, filing and tracking disputes until the credit posts, processing MACD tickets, and reconciling wireless serial numbers and Employee IDs against the HR roster so departed employees stop billing.
The results come from the work, not the file. A Fortune 100 manufacturer recovered $450,000 in telecom refunds in its first year with RadiusPoint and roughly $850,000 in ongoing annual savings while managing more than 10,000 wireless devices, and inventory reconciliation on another engagement recovered $174,000 in re-credits. The same record structure carries into utility expense management (UEM, meaning Utility Expense Management), where one multi-location client recovered about $18,000 a year from utilities still billing at closed locations. Whether you’re standing up a new program or moving off a file, the starting point is the same: getting the onboarding data into a record that finally links the pieces.
Frequently Asked Questions
ExpenseLogic answers the tracking questions spreadsheet teams face when history, evidence, and concurrent ownership outgrow one file.
Can I just export from ExpenseLogic to Excel?
Yes. ExpenseLogic exports to Excel, CSV, and PDF whenever you need it, so nobody is trapping your data. The distinction is that an export is a snapshot, while the live record keeps the history, the images, and the links between inventory, contract, MACD ticket, invoice line, and GL code. You can take the numbers to a spreadsheet anytime. What you can’t take is the evidence chain that made those numbers defensible.
When is a spreadsheet actually sufficient?
When the estate is small, stable, and owned by one person: a few BANs, one or two carriers, and little monthly MACD activity. If you can answer what changed and who approved it straight from the file, and no one is asking for invoice images or dispute proof, you’re below the concurrency breaking point and a spreadsheet is a fair tool. The moment two or more of the checklist signals above are true, that stops being the case.
Does this cover utilities and UEM meters?
Yes. ExpenseLogic tracks utility expense management alongside telecom and wireless, including meter-level detail, tariff and rate data, and billing at closed or vacant locations. Because utilities sit in the same record structure as telecom, one reconciliation and one general ledger process cover voice, data, wireless, and facility invoices instead of three separate spreadsheets that never quite agree.
Can it track wireless serial numbers and Employee ID?
Yes. ExpenseLogic stores device detail at the serial-number level and reconciles each line to an Employee ID and the HR roster. That link is exactly where ex-employee lines and zero-use devices surface, because the platform can compare who a line is assigned to against who still works there. A spreadsheet has no reliable connection to HR, which is why those lines keep billing.
If we switch, do we lose our inventory history?
No. Preserving the inventory of record is the whole objective of onboarding, and RadiusPoint rebuilds it from carrier orders, CSRs, and your existing file rather than starting from a blank sheet. If you’re weighing a move, the mechanics of switching TEM without losing your inventory are worth reading before you commit, because a clean transfer is what protects the history you already paid to build.
See what your spreadsheet can’t show you
Every month the evidence stays uncaptured, a dispute window closes on a credit you could have won and a change goes into the estate with no record of who made it. The fix isn’t a better template. It’s a record that links inventory to contract to MACD to invoice line to GL, and a team that works that record for you. Ask RadiusPoint to audit one month of your invoices in ExpenseLogic, and see in specific dollars, with the images to prove it, what your spreadsheet has been unable to track.
Multi-Carrier TEM: Reconciling AT&T, Verizon, and Regional BANs in One Estate
By Sharon Watkins, Founder and CEO, RadiusPoint
Multi-carrier TEM works when AT&T, Verizon, and regional carrier BANs share one inventory schema, one audit ruleset, and one GL coding model inside a single estate. The moment each carrier keeps its own spreadsheet language, reconciliation stops being analysis and turns into translation, and the errors that matter start hiding in the gaps between files.
Picture a mid-market company that just acquired a competitor with three sites in another state. Overnight it inherited a regional carrier it had never billed against, a fresh set of billing account numbers, and an accounts payable team now approving invoices in two formats it only half understands. Nothing breaks on day one. The break comes a quarter later, when a disconnected circuit keeps billing and nobody catches it, because that carrier’s invoice lives in its own file and answers to no one. The multi-carrier problem is a data problem before it is a cost problem, and RadiusPoint treats it as one by starting with the billing account number rather than the invoice total.
Key Takeaways
- National and regional carriers differ in customer service record formats and charge codes, so your inventory schema has to normalize them before any spend comparison means anything.
- BAN-level ownership prevents orphan regional accounts from surviving quietly after an acquisition or a local site build.
- One estate means one exception queue and one close file, not three carrier-specific closes that never agree with each other.
- RadiusPoint loads multi-carrier BANs into ExpenseLogic so analysts audit different invoice languages against one inventory of record.
Why Multi-Carrier Estates Break First at the BAN Layer
Multi-carrier programs break when each carrier’s BAN set lives in a separate file with no shared owner, status, or cost-center map. A BAN, the billing account number a carrier uses to group services under one bill, is the unit everything else hangs from, and once you hold BANs from several carriers, the weakest link is never the biggest bill. It is the small account no analyst was assigned to watch.
The failure mode is predictable. National carriers get attention because their invoices are large and their portals are familiar. Regional carriers arrive through acquisitions, local builds, or a single site only one provider serves, and they slot into a spreadsheet as an afterthought. That spreadsheet has no concept of status, so a circuit that should have been disconnected keeps paying. It has no owner, so no one is accountable when a charge drifts, and no cost-center default, so finance codes it to a catch-all where the variance disappears into overhead.
This is the complexity threshold where a managed telecom expense management program earns its keep. A single carrier can be run out of a well-kept spreadsheet by a diligent person. Three to seven carriers, each with its own billing format and dispute path, cannot, because the human effort scales faster than the savings. The estate does not need more spreadsheets. It needs one schema every carrier’s data is forced to enter.
Normalize National and Regional Invoice Languages
Normalize product codes, tax lines, and service ID formats from AT&T, Verizon, and regional carriers into one ExpenseLogic schema before you compare spend. Carriers do not describe the same service the same way. One labels a charge as network access, another buries it in a bundled feature code, a third splits it across two line items with a surcharge attached. Compare those raw invoices and you are comparing vocabularies, not costs.
Normalization is a ladder, and each rung turns raw billing into something you can audit. No charge reaches your general ledger, the finance system’s chart of accounts, until it has passed every rung.
| Rung | Layer | What happens | Output you can trust |
|---|---|---|---|
| 1 | Raw invoice | Charges arrive in the carrier’s own product codes, tax labels, and service IDs by EDI, portal, or paper | Source data only, nothing comparable yet |
| 2 | Charge taxonomy | Each carrier’s line items map to a shared set of categories: access, usage, features, taxes, surcharges, and one-time charges | Like-for-like charge types across every carrier |
| 3 | Inventory key | Every recurring charge ties to a specific circuit, line, or service in the inventory of record | Charges with no matching asset surface immediately |
| 4 | GL code | The normalized, inventoried charge carries a default cost center and a general ledger code | One close file that posts cleanly |
Only after the ladder is climbed does a line-item telecom audit become possible across carriers, because the audit ruleset now reads one taxonomy instead of five. A rate reversion on a Verizon circuit and one on a regional carrier’s circuit look identical to the ruleset, which is the point. Regional carriers are not worse billers than the nationals. They simply speak a different dialect, and normalization translates it rather than penalizing it.
An Ownership Model for Every BAN in the Estate
Assign a business owner, a telecom owner, and a cost-center default to every BAN so regional accounts cannot bill without an accountable party. Ownership is the control spreadsheets never enforce and the one that quietly saves the most, because an owned account gets questioned and an orphan account gets paid.
The grid below is the artifact that makes this real. Every BAN gets a row, and every row names the same five facts. When a new carrier arrives through an acquisition, it does not go live in ExpenseLogic until its rows are complete.
| BAN | Carrier | Business owner | Telecom owner | Default cost center | Status |
|---|---|---|---|---|---|
| 8017-XXXX | AT&T | Regional Ops Director | Analyst A | 6120 East | Active |
| 2245-XXXX | Verizon | Facilities Manager | Analyst A | 6120 West | Active |
| 5590-XXXX | Windstream | Site Lead, Plant 3 | Analyst B | 6135 Plant | Under review |
| 3302-XXXX | TDS Telecom | Unassigned | Unassigned | Default | Orphan, flag |
That last row is why the grid exists. An orphan BAN is not a rare event in a multi-carrier estate; it is the default outcome of acquisition-driven growth unless something forces assignment. Building this census is the first onboarding artifact any serious TEM program should demand, and it should be complete across all carriers before a single invoice is loaded.
A BAN is owned when three roles are named: a business owner accountable for the spend, a telecom owner accountable for the service, and a default cost center for coding. A BAN missing any of the three is an orphan account, and orphan accounts are where regional overbilling lives longest.
One Exception Queue Across Carriers
Run one exception queue ranked by dollars and age so a small regional BAN error does not hide behind national carrier noise. The instinct in a multi-carrier estate is to work each carrier separately, because each has its own portal and dispute process. That instinct is what lets the expensive errors slip, because it ranks work by carrier rather than by impact.
A single queue changes the ordering. Every exception the audit ruleset raises, whatever carrier produced it, lands in the same list, sorted by dollars at stake and how long it has been open. Age matters as much as size, because carrier dispute windows are finite and a correct finding raised too late is unrecoverable no matter how correct it is.
The design has three practical effects. It surfaces a large regional error above a trivial national one, because it ranks money rather than brand. It keeps aging disputes visible so nothing ages past its recovery window. And it gives one analyst a single place to work, so the estate closes from one queue rather than three carrier-specific lists that never agree.
How RadiusPoint Reconciles Multi-Carrier BANs in ExpenseLogic
RadiusPoint consolidates carrier feeds into ExpenseLogic, reconciles BANs to inventory, and produces one audited path to payment and GL posting. The platform holds the schema, the ownership grid, and the exception queue described above, and named people work them. That combination of software and a human on the account is the part a spreadsheet cannot copy.
In practice, ExpenseLogic ingests each carrier’s billing, applies the normalization ladder so AT&T, Verizon, and every regional carrier land in one taxonomy, and matches recurring charges against the inventory of record. Charges that do not match an owned asset become exceptions. A RadiusPoint analyst works that one queue, files disputes through the correct carrier path, tracks each to a credit, and only then releases charges to payment and general ledger posting. The estate closes once, in one file, with one set of cost centers.
This model matters most during change, when multi-carrier estates are most fragile. Acquisitions add carriers and BANs faster than internal teams can absorb them, and a provider transition can quietly lose the inventory that took years to build. The safe path is consolidating carriers without losing your inventory of record, so the BAN census, the ownership grid, and the audit history survive the move. One estate, one schema, one audited path to payment, no matter how many carriers the business collects.
Frequently Asked Questions
Do we need a separate TEM instance per carrier?
No. A separate instance per carrier recreates the spreadsheet problem inside software, because you end up with several systems of record that still have to be reconciled by hand. The value of TEM comes from one estate holding every carrier’s BANs against one inventory, one taxonomy, and one queue. Separate instances just give you separate closes.
How should regional carriers be prioritized?
By spend, site criticality, and invoice complexity, not brand familiarity alone. It is tempting to prioritize the nationals because their names are familiar and their bills are large, but a regional carrier serving a critical plant, or one with a genuinely tangled invoice, often carries more recoverable error per dollar. Rank carriers the way you rank exceptions: by impact.
What about wireless sub-accounts under national carriers?
Treat wireless master accounts and their sub-accounts with the same BAN discipline you apply to fixed services. A master account often hides dozens of sub-accounts, each capable of billing for lines assigned to people who left months ago. Give the master and its sub-accounts owners, statuses, and cost-center defaults like any other BAN. Wireless and fixed spend have their own differences, but the ownership rule does not change.
Can carriers be compared on unit cost easily?
Only after normalization. Raw invoice PDFs are documents, not comparable analytics, so any unit-cost comparison drawn straight from them compares two vocabularies and calls the result a number. Once every carrier’s charges pass the ladder into a shared taxonomy tied to inventory, unit cost becomes a fair comparison. Before that, it is a guess wearing a decimal point.
What is the first onboarding artifact?
How TEM and Accounts Payable Automation Should Split the Work
Sharon Watkins, Founder and CEO, RadiusPoint
A finance team automates accounts payable, watches invoice processing get faster and cleaner, and assumes telecom spend is now under control. Then an audit finds a circuit still billing for a site that closed two years ago, a rate that reverted at renewal, and a mobile line for someone who left last spring. The AP system did nothing wrong. It processed, coded, and paid exactly what it was designed to process, code, and pay. It just had no way to ask whether those charges should have been on the invoice at all.
Here’s the verdict up front. Keep accounts payable automation for invoice logistics, keep telecom expense management for telecom truth and audit, and integrate the two at the general ledger handoff. AP automation owns capture, routing, coding, and payment. Telecom expense management owns the service inventory, the contract rate audit, line-item validation, and carrier disputes. They aren’t rivals. They’re two halves of one workflow. RadiusPoint runs the telecom expense management half through ExpenseLogic, its proprietary cloud platform, and hands your AP system a coded, audited file it can post without rework.
Key Takeaways
- AP automation is a logistics engine for invoices you’ve already decided to pay. It doesn’t decide whether a charge is correct.
- Telecom expense management supplies the two things AP automation lacks: an inventory of what should exist, and a contract rate to check each line against.
- Three-way match can’t guard telecom spend, because recurring services generate no purchase order and no receipt to match the invoice against.
- A clean RACI keeps ownership from blurring, so the TEM provider audits, telecom owns service truth, AP pays, and finance stays informed.
- RadiusPoint and ExpenseLogic don’t replace your AP stack. They feed it a validated file through a fixed handoff contract.
What AP Automation Does Well for Telecom Invoices
AP automation does the logistics well: it captures telecom invoices, extracts the data, routes them for approval, posts the coding, and pays the carrier. That’s real work, and doing it by hand is slow, error-prone, and expensive. A modern AP platform reads a bill, suggests a general ledger code from vendor history, moves it to the right approver, and releases payment before a late fee lands. For a category with hundreds of monthly invoices from dozens of carriers, that automation is genuinely worth having.
The important thing is to be honest about the boundary of that value. AP automation makes a decided invoice move faster. It doesn’t decide whether the invoice was right. It has no inventory of your circuits, no copy of your carrier contracts, and no mechanism to file a dispute. It trusts the bill and processes it. For most vendor categories that trust is reasonable, because a purchase order and a receipt already vouched for the charge. Telecom is the category where that vouching never happened, which is where the second half of the workflow has to begin.
What Only TEM Can Do
Only telecom expense management builds the service inventory, audits each line against the contracted rate, and disputes wrong charges with the carrier until credits post. This is a different discipline with different reference data. Instead of a purchase order and a receipt, it validates every charge against what services should exist and what those services should cost.
Building and holding that reference data is the hard part, and it’s the reason TEM is a standing function rather than a one-time cleanup. Somebody has to pull carrier service records, reconcile them against invoices and site lists, and then keep the inventory current through every move, add, change, and disconnect. Somebody has to keep the rate table matched to signed contracts as they renew. Somebody has to open a dispute when a charge fails, follow it through the carrier’s process, and confirm the credit actually arrives. None of that is an AP task, and none of it happens by itself. Our guide to when you need TEM walks through the signals that this work has outgrown a spreadsheet and a diligent analyst.
Why Three-Way Match Is Not Enough for TEM
Three-way match needs a purchase order and a receipt to compare against, and recurring telecom services produce neither, so the check has nothing to verify. A monthly carrier bill has no discrete order event and nothing to receive at a dock. The control was built for procured goods, and telecom isn’t procured goods.
Organizations work around this in ways that all leak. A blanket purchase order for annual spend only catches invoices above the blanket, which means it misses almost everything, since nearly every error lives inside the blanket. Two-way match compares a total to an order value and never sees a rate that reverted to list price. Variance monitoring flags a sudden jump, but a ghost charge that has billed steadily for a year reads as the baseline, and nobody questions the baseline. A wrong charge that repeats every month looks identical to a right one under any matching rule. The deeper explanation of invoice audit against three-way match covers why the reference data, not the matching logic, is the thing that fails.
Three-way match asks whether the invoice agrees with the paperwork. A line-item audit asks whether the paperwork was ever right.
A Clean RACI for AP, Telecom, and the TEM Provider
A clean RACI assigns the work so nobody double-owns it: the TEM provider audits, telecom approves service truth, AP processes payment, and finance stays informed. When ownership blurs, charges fall between IT, procurement, and finance, and the reconciliation nobody owns is exactly where the leakage lives. Naming a single accountable role for each task closes that gap.
| Task | TEM provider (RadiusPoint) | Telecom / IT | Accounts payable | Finance / Controller |
|---|---|---|---|---|
| Maintain the service inventory | R | A | I | I |
| Audit each line against contract | R | C | I | A |
| File and pursue carrier disputes | R / A | C | I | I |
| Code and allocate to the GL | R | C | C | A |
| Route the invoice for approval | I | C | R | A |
| Execute payment or bill pay | C | I | R | A |
| Own the vendor master data | C | C | R | A |
Read down the first column and the pattern is clear. The TEM provider is responsible for everything upstream of payment, which is truth, audit, and disputes. AP is responsible for everything from approval onward, which is logistics. Finance stays accountable for the numbers landing correctly, and telecom stays accountable for whether a service should exist in the first place. No task has two owners.
How RadiusPoint Hands Work to AP Through ExpenseLogic
RadiusPoint runs the audit inside ExpenseLogic, its proprietary cloud platform, then hands accounts payable a coded file your AP system can post without rework. ExpenseLogic holds the inventory of record and the contract rate table, tests every invoice line against both, and routes failures to RadiusPoint analysts who file disputes with carriers and utility providers. Charges that pass are allocated to cost center, location, and general ledger account, then delivered into your ERP and AP systems. This is additive, not a rip and replace. Your AP automation keeps capturing, routing, and paying, and our invoice auditing services make sure what reaches it is already correct.
The Handoff Contract
The handoff works because both sides agree on a fixed data contract for every line that crosses it. Four fields carry the meaning, and the AP system only ever sees charges that have already cleared the audit.
| Field | What it carries |
|---|---|
| BAN | The billing account number that ties the charge back to the carrier account and to the matching inventory record. |
| Coded amount | The audited, approved figure with its full general ledger and cost-center allocation already applied, ready to post. |
| Exception flag | A marker showing whether the line passed clean or is being held pending a dispute, so AP never pays a contested charge. |
| Period | The service month the charge belongs to, so it posts to the correct accrual and lands in the right close. |
Agreeing on those four fields is usually the first integration worth building, and the cleaner your TEM onboarding data is, the faster the file starts flowing. Once the contract holds, the verdict takes care of itself: AP automation runs the logistics, telecom expense management runs the truth and the audit, and the two meet at one coded handoff into the ledger.
Frequently Asked Questions
Can we turn off TEM if we buy AP automation?
No, because the two don’t do the same job. AP automation captures, routes, and pays invoices. It has no service inventory and no contract rate table, so it can’t tell whether a telecom charge is legitimate. Turning off telecom expense management leaves you paying wrong invoices quickly and cleanly instead of slowly and manually.
Should TEM pay carriers directly?
It can, through bill pay, but it doesn’t have to. Many clients keep payment in their own AP system and use RadiusPoint only for audit, coding, and disputes. Others let RadiusPoint pay carriers after the audit clears. Either model works, as long as the RACI names one owner for payment.
Where do disputes live?
Disputes live with the TEM provider, not with AP. RadiusPoint opens the dispute, works it through the carrier’s process, and confirms the credit posts. The exception flag on the handoff file keeps a contested line out of the payment run until it resolves, so AP never pays a charge that’s still being challenged.
Who owns vendor master data?
Accounts payable owns the vendor master as the system of record for who gets paid, with finance accountable for its integrity. The TEM provider consults on it, mapping carrier billing accounts to the right vendor records so the coded file reconciles cleanly. Splitting it this way stops duplicate vendors and misrouted payments.
Does this apply to utilities too?
Yes. Utility Expense Management, or UEM, has the same structure as telecom. Electricity, gas, water, and waste bill for recurring service with no purchase order or receipt, and their reference data is a tariff schedule and a meter inventory rather than an order document. The audit and the handoff work the same way.
What is the first integration to build?
Build the coded handoff file first, agreed on the four fields above: BAN, coded amount, exception flag, and period. It’s the smallest change that delivers the whole benefit, because it lets audited charges flow straight into AP. Direct bill pay, deeper ERP feeds, and inventory syncs can follow once that file is reliable.
Utility Meter Inventory: The UEM Parallel to a Telecom Service ID File
By Sharon Watkins, Founder and CEO, RadiusPoint
A utility meter inventory is the UEM parallel to a telecom service ID file because both are the authoritative list of every billable identifier an organization pays for, and both are the level where a real audit actually happens. In Telecom Expense Management (TEM), an auditor works from the service ID, the unique number tied to a single line, circuit, or trunk. In Utility Expense Management (UEM), the equivalent unit is the meter. Audit the meters and you’re doing expense management. Pay the account totals and you’re only doing bill pay.
Here’s the thesis in one line: UEM audits at the meter level the way TEM audits at the service ID level, and without a meter inventory of record, utility bill pay is payment, not expense management. That gap has a price. When a site closes or a unit goes vacant and its meter never leaves your inventory, the invoice keeps arriving and finance keeps paying it. At RadiusPoint we run UEM on ExpenseLogic right beside TEM, on one platform, so the same discipline that catches a ghost phone line also catches a meter that should have gone dark months ago.
Key takeaways
- A utility meter is the UEM equivalent of a telecom service ID, the smallest unit a real audit can work from.
- Bill pay without a meter inventory is payment only. Meter-level auditing is what turns it into expense management.
- A meter inventory of record needs six fields at minimum: meter ID, commodity, site, tariff class, status, and cost centre.
- Closed and vacant sites are where a missing meter costs the most, because nobody’s watching an invoice for a location nobody visits.
UEM versus paying the utility bill
Utility Expense Management is the practice of validating utility charges at the meter level, and it’s a fundamentally different job from paying the utility bill. Bill pay is a three-step loop: receive the invoice, code it, remit the payment. It answers one question, whether the bill got paid on time. UEM answers a harder set. Is this meter on the correct tariff class? Does the consumption make sense for this site? Did a charge cross a threshold that signals an error? Is the cost landing in the right cost centre?
Those questions map to three kinds of audit that only exist once you work at the meter level: a contract and tariff rate audit, a consumption-based audit, and a threshold-based audit. None of them are possible from an account total, because a total hides the meter that’s wrong behind the meters that are right. It’s the same reason a telecom invoice total tells you nothing useful until you break it down by service ID. A program that stops at bill pay is paying accurately and auditing nothing. Knowing when a managed expense program earns its keep starts with recognizing that the audit, not the payment, is where the money is.
Why the meter is the service ID of utilities
The meter is the service ID of utilities because it’s the one identifier that ties a physical point of consumption to a rate, an account, and a cost centre, which is exactly what a telecom service ID does for a line or circuit. Every discipline TEM applies to a service ID has a clean counterpart in UEM at the meter. The unit of consumption changes from minutes and data to kilowatt-hours, therms, CCF, and gallons, but the structure is identical: an identifier, a rate applied to it, a volume measured against it, and a cost centre it belongs to.
| Dimension | Telecom (TEM) | Utility (UEM) |
|---|---|---|
| Core identifier | Service ID (line, circuit, or trunk) | Meter ID (meter number) |
| What it identifies | A single billable telecom service | A single physical point of consumption |
| Account grouping | Billing account number (BAN) | Utility account number |
| Unit of consumption | Minutes, data, ports, circuits | kWh, therms, CCF, gallons |
| Rate structure | Tariff, rate plan, USOC | Tariff class, rate schedule |
| What the audit checks | Contract rate versus billed, zero-use lines, cramming | Tariff class fit, consumption anomalies, threshold breaches |
| Change events | Moves, adds, changes, disconnects (MACD) | Service start, transfer, close, vacancy |
| Cost allocation key | Cost centre by service ID | Cost centre by meter ID |
| Failure mode when missing | Ghost line keeps billing | Meter at a dead site keeps billing |
The tariff class row is where a lot of recoverable money hides. A meter left on the wrong rate schedule after a site’s usage profile changed can overbill for years without ever triggering a late payment. That’s a meter-level finding, and it’s the utility version of a telecom line stuck on an outdated contract rate. RadiusPoint treats it exactly that way through utility rate reclassification, which is only possible when every meter carries its tariff class in the inventory. You cannot reclassify what you have never recorded.
Building a meter inventory of record
Building a meter inventory of record means creating one authoritative list of every meter, reconciled against actual invoices, so no billable point of consumption exists off the books. The build follows the same path as a telecom inventory. You extract every identifier from the invoices, cross-check it against a physical site list, and resolve the two into a single source of truth. In telecom that source is the service ID file. In utilities it’s the meter inventory. The onboarding work that produces a clean TEM data foundation is the direct model for how a meter inventory gets stood up.
At minimum, every meter record in ExpenseLogic captures these six fields.
| Field | What it records | Why the audit needs it |
|---|---|---|
| Meter ID | The unique meter or account number the utility bills | The primary key every charge and audit ties back to |
| Commodity | Electricity, gas, water, sewer, or waste | Sets which consumption logic and units apply |
| Site | The physical location the meter serves | Links the meter to a real, verifiable building |
| Tariff class | The rate schedule the meter is billed on | Enables the rate and reclassification audit |
| Status | Active, closed, or vacant | Flags meters that should no longer be billing |
| Cost centre | The department or entity the cost belongs to | Drives accurate allocation and chargeback |
Closed and vacant sites where meter inventory pays off
Closed and vacant sites are where a meter inventory pays for itself, because a meter that stays active after a location goes dark keeps billing every month with nobody left to review the invoice. This is the utility twin of the ex-employee wireless line no one disconnects. The location is empty, the service is still on, and the charge flows straight through bill pay because it looks exactly like every legitimate invoice. The status field in the inventory is the only thing that catches it, which is why a meter inventory without a status column simply cannot do this work.
Property management feels this most sharply during tenant transitions. A tenant moves out, never transfers the account, and the utility keeps billing the property owner for a unit generating zero revenue. Recovering those charges is the core of vacant utility cost recovery, and it only works when you can prove which meters map to which vacant units. One multi-location RadiusPoint client recovered about $1,500 a month, roughly $18,000 a year, from utilities that were still billing at locations the company had already closed. That money was recoverable for one reason: the meters were in the inventory, flagged by status, and audited against the site list. Without the inventory, those invoices would still be quietly paid.
One ExpenseLogic estate for TEM and UEM keys
Running TEM and UEM on one ExpenseLogic estate means telecom service IDs and utility meters live in the same system of record, audited by the same team against the same rules. Most vendors split these into separate products, which forces you to maintain two inventories, two audit workflows, and two exception queues that never talk to each other. On ExpenseLogic, the service ID file and the meter inventory are two expressions of one idea, a complete list of every billable identifier, each carrying its rate, its status, and its cost centre.
The verdict
The verdict is simple. If you can’t produce a current list of your meters with their commodity, tariff class, status, and cost centre, you don’t have Utility Expense Management, you have utility bill pay. The meter is the service ID of the utility world, the meter inventory is your service ID file, and the audit that recovers real money can only happen at that level. Build the inventory of record first. Everything else in UEM, from rate reclassification to vacant cost recovery, depends on it.
Frequently asked questions
Does UEM mean Unified Endpoint Management here?
No. In this article UEM means Utility Expense Management, the practice of auditing electricity, gas, water, sewer, and waste charges at the meter level. Unified Endpoint Management is a separate discipline in device and IT security that happens to share the acronym. When RadiusPoint says UEM, it always means the utility spend side of ExpenseLogic.
What is a meter inventory of record?
A meter inventory of record is one authoritative, invoice-reconciled list of every utility meter an organization pays for, with each meter carrying its meter ID, commodity, site, tariff class, status, and cost centre. It’s the utility equivalent of a telecom service ID file.
How does a utility meter compare to a telecom service ID?
A utility meter is the direct counterpart of a telecom service ID, since both are the smallest billable unit and the level at which a genuine audit takes place. A service ID ties a rate and a cost centre to a single line or circuit. A meter ties a tariff class and a cost centre to a single point of consumption.
Why do closed or vacant sites cost so much in utilities?
Closed or vacant sites cost so much because their meters often stay active and keep billing long after anyone stops reviewing the invoice. The charge looks legitimate, so bill pay processes it without question. Only a meter inventory with a status field catches it, which is what makes vacant cost recovery possible
Can TEM and UEM run on the same platform?
Yes. RadiusPoint runs both Telecom Expense Management and Utility Expense Management on ExpenseLogic, so service IDs and meters share one system of record, one audit workflow, and one exceptions queue.
Telecom Contract Notice Windows: Catching Silent Renewals Before They Lock
By Sharon Watkins, Founder and CEO, RadiusPoint
To catch a telecom contract before it silently renews, tie three facts together well ahead of the deadline: the term end date, the notice-by date, and the billing accounts and service IDs the contract actually covers. Auto-renewal clauses roll you into another term, often at reverted rates, unless written non-renewal notice lands inside a window that commonly runs 30 to 90 days before expiration. A renewal alert only prevents the lock-in if it reaches a named owner while there’s still time to act.
Most teams treat a contract renewal as a date on a calendar. It’s more accurate to treat it as the last day you had a choice. Up to that day you can renegotiate, switch carriers, or walk away. One day past the notice-by deadline, the same contract becomes a fact you now pay for, usually for another one to three years, and often at a rate nobody agreed to in a meeting. The clause did exactly what it was written to do. The failure was upstream, in whether anyone was watching the date.
Key Takeaways
- Notice deadlines commonly fall 30 to 90 days before the term ends, and some carriers push that to 120 or 180 days. The exact number is buried in the clause, not on the pricing page.
- Contracts kept in email and inventory kept in a spreadsheet are the combination that produces silent renewals. Neither one alerts anybody.
- Link every notice-by date to the billing account numbers and service IDs it covers, so an alert can say what it protects, not just that something expires.
- RadiusPoint’s ExpenseLogic holds contract images, expiration dates and obligation alerts against the same inventory it audits every billing cycle.
How Notice Windows and Auto-Renew Clauses Work
A notice window is the fixed period before your term ends when you must tell the carrier, in writing, that you won’t renew. Miss it, and the auto-renewal clause (sometimes called an evergreen clause) does the rest. The contract rolls into a fresh term automatically, and your right to renegotiate closes with the window.
Four parts of the clause decide how much a missed window costs, and they’re worth reading together.
| Part of the clause | What to check | Why it bites |
|---|---|---|
| Initial term | 12, 36, 60 or 84 months | Sets how long you’re committed and when the renewal clock starts ticking |
| Renewal term | Same length, shorter, or a month-to-month rollover | Decides how long a missed window locks you in, another year or another three |
| Notice window | Commonly 30 to 90 days before term end | The single deadline that actually triggers the lock-in |
| Renewal pricing | Fixed, capped, or “then-current list price” | Whether the new term quietly costs more than the one you negotiated |
Two of these bite after the fact. If a renewal reverts pricing to list, your monthly recurring charge climbs the moment the new term starts. And if you try to leave once you’re locked in, the early termination fee usually equals the remaining months of the term multiplied by the monthly charge, plus repayment of any promotional credits, waived installation or discounted hardware from the original deal. The window matters more than the exit: leaving is expensive on purpose, not renewing is free if you act in time.
Why Silent Renewals Still Happen in Mature Estates
Large estates miss deadlines not from carelessness but because the people, records and systems that hold the dates keep drifting apart over time. The bigger and older the estate, the more places a renewal date can hide. Four failure modes account for most of it.
- Owner attrition. The person who signed the contract has left, and the carrier’s renewal reminder still routes to a mailbox nobody reads. The date exists; the reader doesn’t.
- BAN sprawl. Billing account numbers multiply across carriers, regions and acquisitions until no single list maps contracts to what’s actually billing. You can’t defend a deadline you can’t find.
- PDF-only storage. The contract lives as a scanned PDF in a shared drive, with the notice-by date trapped inside a clause no system can read, sort or alert on.
- Missing ETF awareness. Nobody knows what leaving would cost, so even a renewal that’s caught in time gets rubber-stamped rather than challenged.
Every one of these is a records failure, not a judgment failure. The managers involved are perfectly capable of making the call. They just never got a prompt they could act on, attached to information they could trust. That crossover, where manual tracking stops scaling, is when telecom expense management starts to pay for itself.
A Practical Notice-Window Calendar for Telecom and Procurement
A working renewal calendar counts backward from the term end and assigns a named owner an action at each staged deadline before notice closes. The moment you sign, record the term end date and count back from there. Staged alerts turn a single terrifying deadline into a sequence of small tasks. Recording the dates this early also feeds renewals into demand planning and forecasting, so each decision lands inside the budget cycle.
- 120 days out. Pull the contract, confirm the notice window and the exact delivery method, and start a vendor performance review.
- 90 days out. Decide: renew, renegotiate or exit. If you’re renegotiating or leaving, get competing quotes now, while the carrier still has a reason to compete.
- 60 days out. If you’re not renewing, draft and send written notice by the method the clause requires. Don’t wait for the last legal day.
- 30 days out. Confirm the carrier acknowledged the notice in writing. If it’s silent, escalate before the window shuts.
The calendar only works if each contract carries the same small set of fields. At a minimum, every tracked contract needs five.
- Term end date. The day the current term expires.
- Notice-by date. The last day written non-renewal notice can land, counted back from the term end.
- Owner. One named person accountable for the decision, not a shared inbox.
- BAN list. The billing account numbers and service IDs the contract covers.
- Delivery method. Exactly how notice must be sent, whether that’s certified mail, a carrier portal, or a registered address named in the clause.
Inventory Linkage That Makes Alerts Actionable
An alert only helps if it names the billing accounts and service IDs it covers, so you know exactly what a renewal locks in. A reminder that reads “Carrier X master agreement expires” is nearly useless across a real estate. It doesn’t tell you which circuits, sites or lines it governs, so you can’t price the decision. Tie the notice-by date to the BANs and service IDs, and the same alert now shows what’s at stake and what walking away would actually mean.
Inventory linkage also catches the failure that a calendar alone never will. When a negotiated rate expires and the account quietly returns to list price, the renewal date can pass on time and the overbilling still starts. The only thing that catches rate reversion is a line-item comparison of each invoice against the contracted rate table, which is the discipline of a continuous invoice audit rather than a diary entry. That verified inventory is also the difference between switching TEM without losing inventory and starting over blind.
How RadiusPoint Surfaces Obligation Alerts
RadiusPoint stores each contract, its expiration and its notice-by date inside ExpenseLogic, tied to the same inventory its analysts audit every billing cycle. The contract management module holds the contract image, the expiration date and the negotiated rates against service IDs, and it raises obligation alerts covering both termination fees and dates. Those alerts route to a named owner rather than into the void.
Because the platform audits every invoice line against the contracted rate table each cycle, a rate that reverts at renewal gets caught as a billing exception, not just as a date that passed. Software surfaces the alert; a named RadiusPoint analyst works it, files disputes when a rate slips, and pursues credits until they post. In one case, a client recovered $120,000 a year once contract rates were tied to service IDs and audited every cycle, a figure specific to that estate rather than a number to expect. This is what continuous telecom expense management does that a spreadsheet cannot. The questions worth asking any TEM provider start with how they tie contract terms to inventory and who works the alert.
The Verdict
Catching silent renewals is a records problem, not a negotiation problem, and it’s solved before the notice window opens, not after it closes. Every term that renews unwatched is another one to three years at a rate you never tested against the market, plus an early termination fee if you try to leave. The fix costs far less than a single missed window: put every contract’s term end, notice-by date, owner and BAN list in one place, and alert the owner while there’s still room to act. Ask RadiusPoint to inventory your contracts and set the alerts against the services they cover.
Frequently Asked Questions
These are the questions procurement and telecom managers ask most often when they start tracking telecom contract notice windows and non-renewal deadlines seriously.
How do I find the notice window in a telecom contract?
Read the clause, not the pricing page. Look in the general terms and conditions for language like “automatic renewal,” “renewal term” or “automatic extension,” then confirm the exact number of days and the required delivery method.
How should I send a non-renewal notice?
Send it exactly the way the clause specifies, which is often certified mail or a named carrier portal, and treat the send as a task rather than a memory. Record the tracking number, the date, and the carrier’s written acknowledgment. If the clause requires certified mail and you email it instead, the carrier can treat the notice as never given.
Who should own catching renewals, finance or procurement?
Finance sees the spend, but procurement or the telecom team executes the notice, so the owner has to be whoever can actually send it and run the negotiation. A dashboard that finance watches and procurement acts on works only if one named person is accountable for the decision on each contract.
When should I start renegotiating?
Before the notice-by date, not the term end. Once the window closes, you’ve renewed, and your negotiating position is gone for another full term. Starting at 90 to 120 days out gives you time to gather competing quotes while the carrier still competes for your business.
Do wireless contracts need the same notice discipline?
Yes. Wireless agreements carry the same auto-renewal and notice mechanics as wireline, and they change faster because lines and devices turn over constantly. Applying the same term-end, notice-by and owner tracking to managed mobility keeps mobile contracts from renewing on stale line counts nobody reconciled.
Wireline vs Data Circuit Expense Management: Same Platform, Different Keys
By Sharon Watkins, Founder and CEO, RadiusPoint
Voice wireline and data circuits move through the same telecom expense management lifecycle, but they cannot share one inventory key. Voice keys on telephone numbers under a billing account number. Data keys on circuit IDs, bandwidth, and location pairs. Run both on one platform with category-correct keys, and finance gets a single audit trail while telecom keeps accurate inventory.
The confusion rarely surfaces until month-end. A controller pulls one telecom accrual, ties the voice invoices to a phone-number list, then runs the same match against the data invoices and finds that nothing lines up. Circuit invoices do not carry phone numbers. They carry circuit identifiers, bandwidth tiers, and the two addresses each circuit connects. The two spend types belong to one discipline, yet they are keyed, contracted, and audited differently, and treating them as a single list is exactly where reconciliation breaks.
Key Takeaways
- Voice keys on telephone numbers under a BAN; data keys on circuit IDs, bandwidth, and location pairs.
- Voice uses seat or line rates; data uses port, loop, and committed bandwidth terms.
- Voice audits features and usage; data audits installed versus billed service and MRC variance.
- RadiusPoint runs both categories in ExpenseLogic with category correct keys and shared GL output.
One lifecycle, two inventory keys: where voice and data split
Both voice wireline and data circuits run the same four stages of order, inventory, invoice audit, and pay, but voice keys on telephone numbers while data keys on circuit identifiers and endpoints. The lifecycle is what makes them one discipline. The inventory key is what makes them two problems inside it. A voice line is identified by its number, grouped under a billing account number (BAN), and described by its feature set. A data circuit is identified by a circuit ID, sized by committed bandwidth, and defined by the two locations it joins, the A end and the Z end.
That single difference cascades through every later stage. It changes what the order confirms, what the inventory of record stores, what the audit tests, and what accounts payable is being asked to approve. Deciding whether that lifecycle belongs in-house or with a provider is a separate question, covered in our guide on when you need TEM. The keying difference below applies either way.
| Dimension | Voice wireline | Data circuit |
|---|---|---|
| Primary inventory key | Telephone number under a BAN | Circuit ID |
| Supporting identifiers | BAN, feature and USOC codes, site | Bandwidth tier, location pair (A end and Z end), site |
| Contract unit | Seat or line rate | Port, loop, and committed-bandwidth terms |
| Characteristic audit test | Feature and usage anomalies against the contracted rate | Installed versus billed, plus mileage or MRC variance |
| Common leakage | Legacy features, unused lines, rate reversion at renewal | Disconnected circuits still billing, bandwidth mismatch, closed-location circuits |
A voice audit asks whether the number should still exist. A data audit asks whether the circuit was ever installed at the bandwidth you are paying for.
Voice wireline expense management: auditing numbers under a BAN
Voice wireline expense management tracks numbers, features, and usage against contract rates under each billing account number before accounts payable releases the invoice. The unit of work is the telephone number. Every number rolls up to a BAN, every BAN rolls up to a carrier contract, and the audit tests each number against the rate and feature set that contract actually specifies.
The errors cluster in predictable places. Features billed per line and applied estate-wide long after anyone used them. Lines that survive a role change or an office move because nobody cancelled them. Long-distance and usage charges that drift above the contracted rate. Rates that revert to list pricing at renewal because the amendment was never loaded into the rate table. None of these are exotic. They persist because a manual reviewer cannot test hundreds of numbers against contract terms every cycle, so the invoice gets approved on its total rather than its lines. A line-item audit reverses that default, testing each number before payment rather than sampling after it. The mechanics of that recurring test are set out in our telecom audit services overview.
Data circuit expense management: auditing IDs, bandwidth, and endpoints
Data circuit expense management validates circuit IDs, bandwidth, locations, and monthly recurring charges against the inventory of record and the contract. Here the unit of work is the circuit, and the reference data is harder to hold. A circuit does not announce itself with a phone number. It appears on the invoice as an identifier, a bandwidth level, a pair of addresses, and a monthly recurring charge, and every one of those has to match a maintained inventory record for the charge to be legitimate.
Data circuits also fail in a way voice lines rarely do: they keep billing after they are gone. A disconnected MPLS or SD-WAN circuit that was ordered off but never confirmed off will bill for months, because the carrier’s billing system and the client’s inventory are not the same record. Bandwidth is a second recurring problem, where a circuit contracted at one tier bills at another, or a port charge outlives the loop it supported. Closed and relocated sites produce a third, with circuits still charging monthly recurring cost at addresses the business has vacated. Catching these means testing installed against billed, checking mileage or MRC variance, and matching every circuit ID on the invoice to a circuit in inventory. The full validation sequence sits in our invoice auditing services.
Align five fields, and one close covers both categories
Controllers and telecom teams can keep category-correct keys and still close as one, provided five fields are identical across voice and data. The keys diverge on purpose: a number is not a circuit ID and should not be forced into the same field. What has to match is the connective tissue that lets both categories feed a single accrual and a single general ledger interface. Align these five, and the difference between a number and a circuit ID stops mattering to finance. The comparison logic that separates wireless keying from wireline keying is developed further in our note on wireless versus telecom expense management.
The Shared-Close Rule. Five fields controllers require identical across both categories, even when the inventory keys differ:
- Billing account number (BAN). The account each service rolls up to, so voice and data on the same account reconcile to the same payable.
- Service ID type. A single field that flags whether the record is keyed by number or by circuit ID, so both resolve through one logic rather than two spreadsheets.
- Site or location code. The shared address key that lets a closed location surface every voice line and every circuit billing against it at once.
- Cost center. The allocation target, identical in structure across categories, so chargeback and GL coding do not fork by spend type.
- Contract rate reference. The pointer to the contracted rate or bandwidth term, so every line is testable against what was actually agreed.
Why RadiusPoint runs voice and data on one ExpenseLogic estate
RadiusPoint manages wireline voice and data circuits in one estate on ExpenseLogic, so finance gets one audit trail while telecom keeps category-correct inventory keying rules. ExpenseLogic holds the rate table, the inventory of record, and the invoice history for both categories in a single system, keying voice on telephone numbers under each BAN and data on circuit IDs, bandwidth, and location pairs. ExpenseLogic validates every invoice line against the contracted rate, the provisioned service, and the applicable tax treatment each billing cycle. RadiusPoint analysts file disputes directly with carriers under a letter of agency, pursue each case until the credit posts, and update the inventory of record as moves, adds, changes, and disconnects occur. ExpenseLogic then feeds allocated, coded charges into the client’s ERP and accounts payable systems from one close.
The cost of not doing this compounds monthly. Every cycle a data estate goes unaudited, disconnected circuits keep billing at full monthly recurring charge and closed-location circuits keep posting to live cost centers. Every cycle a voice estate goes unaudited, reverted rates and orphaned features bill again at the same amount they billed last month. A one-time sweep converts that history into a refund. A continuous audit converts the same analytical work into error that never reaches an invoice, which is money kept rather than money recovered.
Ask RadiusPoint to audit one month of your wireline voice and data invoices on ExpenseLogic, and see how many circuit IDs and telephone numbers on your current bill no longer match your inventory of record.
FAQ
Voice and data should share one TEM platform while retaining category specific inventory keys.
Should voice and data have separate TEM tools?
Separate tools multiply GL and inventory reconciliation. Prefer one ExpenseLogic platform with different keys for each product family.
Where does wireless fit in this comparison?
Wireless is a third keying model based on device and Employee ID. It should not be forced into voice or circuit inventory.
What breaks first when keys are mixed?
Data circuits billed like phone lines, or voice features lost inside circuit summaries, create false inventory and unreliable reconciliation.
Do MACD workflows differ?
Yes. Voice MACD often means feature or number changes. Data MACD means bandwidth, demarcs, and install verification.
Can one LOA cover both?
Scope carefully by product family. Ordering rights for circuits are not the same as ordering rights for voice lines.
What a Customer Service Record (CSR) Reveals That Your Invoice Hides
By Sharon Watkins, Founder and CEO, RadiusPoint
A Customer Service Record (CSR) is the carrier’s record of what it has provisioned on your account, every service and feature, line by line. A telecom invoice is narrower: the carrier’s demand for payment this period, with that detail compressed into totals. So a real audit starts from the CSR, not the bill, which is why RadiusPoint pulls CSRs into ExpenseLogic and tests each invoice line against what is actually provisioned.
Here’s how it usually surfaces. Someone in finance questions a charge on a telecom bill, a feature that’s been riding the same account for years, and the invoice can’t answer because it never itemized the feature. It rolled the cost into a monthly total and moved on. Pull the CSR, and the feature is right there: provisioned on a specific line, tagged with the order code that put it there and the date it went live. The bill wasn’t hiding it out of malice. It was never built to show you what you’re paying for. The CSR was.
Key Takeaways
- The CSR is the carrier’s view of what’s provisioned. The invoice is the carrier’s view of what to collect this period. They are not the same document, and they don’t carry the same detail.
- Features, USOC order codes, hunting arrangements, and directory listings routinely appear on a CSR while the invoice shows only rolled totals.
- Inactive and pending-disconnect services can sit on a CSR for months and keep generating charges the invoice never flags.
- RadiusPoint loads CSR detail into ExpenseLogic so analysts can match every invoice line to true provisioned inventory.
Payment document versus provisioning document: what each one is really for
Invoices exist to collect payment for a period. CSRs exist to document how the carrier has provisioned your services and features. That single difference in purpose explains almost everything a CSR reveals.
An invoice is a billing artifact. It’s built to state a balance due and get it paid, so it favors a total over transparency. It summarizes, groups, and reprints last month’s recurring charges without re-explaining them. That isn’t deceptive. It’s just what a payment document does.
A CSR is a provisioning artifact. It records exactly what the carrier has turned on: which lines exist, which features sit on each one, how calls hunt between them, which listings are published, and what status each service is in. It’s written in carrier code, which is why it’s rarely read, but it’s the closest thing to ground truth a carrier will hand you.
| Question | The invoice answers | The CSR answers |
|---|---|---|
| What do I owe this period? | Yes, that’s its whole purpose | No, it isn’t a billing statement |
| What is actually provisioned on my account? | Only in summary, if at all | Yes, line by line with order codes |
| Which features sit on which line? | Rarely; usually rolled into a total | Yes, feature by feature |
| Is this service active, pending, or disconnecting? | No status detail | Yes, through service status flags |
| Where is the service located? | Sometimes a billing address only | Service address, listings, and jurisdiction |
The invoice tells you what to pay. The CSR tells you what you’re paying for. Auditing the first without the second is checking arithmetic you can’t actually see.
This is why a line-item audit can’t run on invoices alone, and why our overview of invoice auditing services treats the provisioning record, not the bill, as the reference data every charge gets tested against.
The CSR hidden five: detail your invoice quietly compresses into a total
CSRs commonly reveal feature codes, hunting configurations, directory listings, and service status flags that monthly invoices compress into opaque totals. Five categories account for most of what goes unnoticed.
- Features and USOC codes. Each feature is provisioned with a Universal Service Order Code (USOC) and billed per line. Voicemail, call forwarding, caller ID, and legacy add-ons can persist for years. The invoice shows a feature total; the CSR shows which features, on which lines, at what rate.
- Hunting arrangements. Hunting defines how an unanswered call rolls to the next line in a group. It carries its own charges and routinely outlives the phone system it was built for. Invoices don’t describe hunt groups. CSRs do.
- Directory listings. Published, non-published, and additional listings each carry a recurring charge. A company can pay for listings tied to departments or locations that closed long ago, and never see them itemized on a bill.
- Service status flags. A CSR records whether a service is active, pending, or disconnecting. That status is the difference between a charge you should pay and one you shouldn’t, and the invoice carries none of it.
- Pending and stranded disconnects. A service ordered off but never confirmed off can sit on the CSR in a limbo state, billing every cycle. The bill looks unchanged, which is exactly the problem.
Reading these categories against the bill is the core of what a real audit does, and it’s the reason our telecom audit services reconstruct the CSR before testing a single invoice line.
How a hidden CSR line turns into paid waste
When CSR lines stay active after a site closes or an employee leaves, the invoice keeps charging while accounts payable has no inventory flag telling it to stop. The waste is quiet, and it compounds.
Consider the mechanics. A location shuts down. The lease ends, the staff move, the lights go off. The telephone lines and features provisioned to that address, though, don’t disconnect themselves. Unless someone issues a disconnect order and confirms it posted, those services stay on the CSR, and every charge tied to them keeps flowing onto an invoice that gets approved on its total. Accounts payable pays it because nothing on the bill says the site is gone. Nothing on the bill ever could.
The same pattern hits individual services: a feature nobody uses, a line assigned to a role that no longer exists, a listing for a merged division. Each one is small. Each one recurs. And because the invoice reprints the total rather than re-justifying the line, the charge renews month after month with no natural moment of review. A CSR-driven audit creates that moment on purpose, and when it finds a service that should have stopped billing, the next step is recovering what was already paid. That recovery work is described in our note on telecom refunds and cost avoidance.
How finance and telecom should read a CSR together
Finance should learn which CSR fields drive cost, while telecom owns service status and change activity, so both teams share one interpretation of the same record inside ExpenseLogic.
The two teams read a CSR for different reasons, and both readings matter. Finance cares about the fields that map to money: the billing account number a service rolls up to, the cost center it should be allocated to, the rate each feature carries, and the tax jurisdiction that applies. Telecom cares about the fields that describe reality: which services are active, what’s pending a move, add, change, or disconnect (MACD), and whether the provisioned configuration still matches how the business actually operates.
Neither reading is complete alone. Finance can flag a charge that looks wrong but can’t say whether the underlying service should exist. Telecom knows the service should be gone but doesn’t see it hitting a live cost center every month. Put both readings on the same record, and a stranded line becomes visible from two directions at once. Turning that shared reading into a maintained system, rather than a one-time exercise, is the subject of our guide to building a telecom inventory of record from carrier CSRs.
The short version
If you remember one thing, make it this: the bill is not the inventory. A telecom invoice tells you what a carrier wants paid. A CSR tells you what the carrier has actually provisioned, and the gap between the two is where overcharges live. Start every audit from the CSR, reconcile the invoice to it, and the questions your bill can’t answer suddenly have answers.
How RadiusPoint turns CSR insight into audit action
RadiusPoint compares CSR extracts to invoices and contracts inside ExpenseLogic, then opens disputes or disconnect tickets on anything that shouldn’t be billing. Software finds the mismatch; people resolve it.
RadiusPoint requests CSRs from each carrier under a letter of agency and loads the extracted detail into ExpenseLogic alongside the rate table, the inventory of record, and the invoice history. ExpenseLogic validates every invoice line against the provisioned service, the contracted rate, and the applicable tax treatment each billing cycle. When a charge has no matching CSR line, or a CSR line carries a status it shouldn’t, ExpenseLogic flags the exception and RadiusPoint analysts take it from there, filing disputes with the carrier, pursuing each case until the credit posts, and issuing disconnect orders on services that should have stopped. RadiusPoint updates the inventory of record as moves, adds, changes, and disconnects occur, so the next cycle starts from an accurate baseline rather than repeating the same finding.
The result is one audit trail for finance and one accurate provisioning record for telecom, drawn from the same source. RadiusPoint runs this as a continuous managed service rather than a one-time sweep, which converts the analytical work from money recovered after the fact into error that never reaches an invoice.
Ask RadiusPoint to pull one month of CSRs against your current telecom invoices in ExpenseLogic, and see how many provisioned lines and features on your bill no longer match anything your business still uses.
FAQ
A CSR is the carrier’s provisioning record, and it belongs at the start of any telecom audit, not the invoice alone.
Is a Customer Service Record a free document?
It depends on the carrier. Some deliver a CSR electronically at no charge, others treat it as a special request. Access is a right you can scope through a letter of agency (LOA), so build CSR retrieval into the LOA rather than negotiating it case by case.
How is a CSR different from a bill of materials?
A CSR is the carrier’s record of provisioned telecom services and features. A bill of materials is a manufacturing and project term for the components that make up a product. The language overlaps in equipment or installation contexts, but for recurring telecom service the document you want is the CSR.
Can electronic bills replace CSRs?
No. E-bills improve how the invoice is delivered and formatted, which helps processing, but they don’t add provisioning detail. An e-bill is still a payment document. It won’t show you feature-level configuration or service status the way a CSR does.
How often does a CSR change?
Any move, add, change, or disconnect can change it. Treat a CSR as a snapshot, not a permanent truth: re-pull it after major changes and on a scheduled refresh, so your inventory of record keeps pace with what the carrier has actually provisioned.
Does wireless have a CSR equivalent?
Not by that name. Wireless carriers provide account and line-level detail extracts that serve a similar purpose, with different field names and structure. Treat them as inventory sources for the wireless estate and reconcile them the same way, invoice line against provisioned record.
How Controllers Use a TEM GL Interface File in Month-End Close
By Sharon Watkins, Founder and CEO, RadiusPoint
Controllers use a TEM GL interface file to turn a month of audited telecom charges into one pre-coded batch the ERP can post in minutes, instead of a stack of invoices someone keys by hand. The file is the finished output of telecom expense management (TEM): every charge has already been checked line by line, mapped to a general ledger account, and tagged to a cost centre. By the time it reaches your close, the coding decisions are done and the disputes are flagged. What lands in the ERP is a reviewed subledger feed, not a pile of PDFs.
Key takeaways
- The GL interface file is the audited product of TEM, not an invoice dump. Each line carries the billing account number, service period, amount, GL account, and cost centre.
- It belongs early in the close, after the audit finishes and before journals lock, so telecom posts alongside every other subledger.
- Clean lines flow straight through; exception lines route to an accrual or a hold, so one disputed charge can’t stall the close.
- RadiusPoint generates the file from ExpenseLogic after line-item audit, so your team posts a reviewed file rather than coding carrier bills.
The short version: an audited, pre-coded GL file lets you post telecom like any other subledger. Clean lines flow through, exceptions get handled on the side, and the work that makes the file trustworthy (the audit and the coding) happens before it ever reaches your ERP.
What’s Actually Inside a TEM GL Interface File
A TEM GL interface file lists every audited telecom charge with its billing account number, service period, amount, GL account, and cost centre for posting.
Start with the fields, because they’re what make the file postable. Each row typically carries the billing account number (BAN), which is the carrier’s account identifier and the anchor for tracing a line back to its source invoice. Alongside it sit the service period the charge covers, the audited amount, the GL account it maps to, and the cost centre or allocation string your organization uses to push spend to the right department, location, or entity.
The file separates into two kinds of rows, and controllers should treat them differently. Clean lines are charges that passed audit and matched contract, plan, and inventory. They’re ready to post with no human touch. Exception lines are charges that failed a check: a rate that doesn’t match the agreement, a service billed after disconnection, a new line nobody ordered, a credit still pending. These don’t get suppressed. They get marked so finance can decide whether to accrue, hold, or post with a note.
Where the GL File Lands in Your Close Calendar
Controllers load the GL file early in the close, after the audit finishes but before journals lock, so telecom posts with other subledgers on time.
Timing is where a good file earns its keep. Telecom is a recurring, high-volume expense that arrives on the vendor’s schedule, not yours, so it has a habit of showing up late and forcing a last-minute manual journal. Placing the feed deliberately fixes that. Below is a Close-Calendar Placement Map most finance teams can adapt to their own cycle.
| Close stage | What happens with the TEM feed |
|---|---|
| Before close opens | Audit completes on the prior month’s invoices; the GL file is generated and delivered to finance. |
| Early close | Clean lines import and post to the telecom accounts and cost centres; the file is balanced to source invoices. |
| Mid close | Exception lines are reviewed; late or disputed charges are accrued or held with a documented reason. |
| Before journals lock | Telecom subledger ties out; any adjusting entries are booked and the version is archived. |
| Post close | Resolved exceptions and vendor credits carry into the next period’s file. |
Handling Accruals and Exception Lines Without a Pile of Manual Journals
Clean lines post straight to the general ledger; exception lines route to an accrual or hold, so the close isn’t blocked by one disputed charge.
This is where the interface and the accrual do different jobs, and it’s worth being precise. The interface file is the posting mechanism for real, audited spend in the period. An accrual is your estimate for spend that belongs to the period but isn’t cleanly billable yet, usually because an invoice is late or a charge is under dispute.
A well-built feed supports both. Clean lines give you the confirmed base. Exception lines give you the accrual candidates, already itemized, so your accrual isn’t a round-number guess. Instead of accruing “telecom, roughly the usual,” you accrue the specific held lines with their amounts and reasons attached. When the dispute resolves or the credit posts, it flows through a later file and the accrual reverses against something concrete.
Balancing matters here too. Before anything posts, the file should tie to the source invoices it was built from, so the total you book reconciles to what carriers actually billed, net of audited adjustments. That reconciliation is what lets you sign the close knowing the telecom line is defensible, not approximated. RadiusPoint’s invoice auditing services are what produce that audited base in the first place, which is why the exception lines are trustworthy rather than arbitrary.
The Controls That Keep the TEM Feed Trustworthy
Feed controls cover versioning, balancing to source invoices, restricted access, and a named coding owner, so the file you post is the file you audited.
A GL feed is only as good as the controls around it, because it writes directly into your books. Use a TEM Feed Control Checklist and run it every period:
- Versioning. Every generated file is versioned and archived. If a correction is needed, you produce a new version rather than editing the posted one, and you can always show which file backed which journal.
- Balancing. The file totals reconcile to source invoices and to the amounts audited before import. No line posts that can’t be traced to a BAN and a service period.
- Access. Only named roles can generate, approve, and import the file. The person who audits isn’t automatically the person who posts.
- Coding owner. One owner is accountable for the GL account and cost-centre mapping. When the mapping changes, that owner signs off before the next file uses it.
The mapping itself is set up once and maintained deliberately, not reinvented monthly. Most of that structure gets defined during onboarding, when your chart of accounts and cost-centre logic are captured. If you want to see what that setup involves, RadiusPoint documents the inputs in its TEM onboarding data requirements, and the sequence in its TEM implementation timeline.
How RadiusPoint Produces a GL-Ready File from ExpenseLogic
RadiusPoint produces the file inside ExpenseLogic after line-item audit, mapping each charge to your chart of accounts, so your team posts instead of coding.
Here’s the part that separates a real GL feed from a spreadsheet export. RadiusPoint audits every invoice line first: rate against contract, service against inventory, plan against usage. Only then does ExpenseLogic assemble the audited charges into a file coded to your GL accounts and cost centres. The output is GL-ready because the review and the coding are already finished by the time it’s generated.
ExpenseLogic covers telecom, wireless, and utility expense management (UEM) on one platform, so the same audited-then-coded logic applies across all three categories and lands in a consistent file rather than three different formats. That single unified feed is easier to control and easier to reconcile.
And it’s software plus people, not software alone. The platform builds and balances the file, but a RadiusPoint analyst works the account, resolves disputes with carriers, and confirms the exception lines make sense before the file reaches finance. Automation handles the volume; a named human handles the judgment. That combination is what lets your controller treat telecom as a clean subledger instead of a monthly investigation.
Frequently Asked Questions
Is the GL interface file the same as an accrual?
No. The interface file posts confirmed, audited spend for the period. An accrual estimates spend that belongs to the period but isn’t cleanly billable yet. The file’s exception lines feed the accrual, so your estimate is itemized rather than a round number.
Doesn’t AP automation already do this?
AP automation routes and pays invoices, but it approves recurring telecom charges by default because there’s usually no purchase order or goods receipt to match against. It doesn’t audit the line against contract, plan, or inventory. The TEM feed adds that audit and the GL coding before anything posts.
What happens when our GL structure or cost centres change?
The coding owner updates the mapping and signs off before the next file uses it. Because the mapping lives in ExpenseLogic and is versioned, the change is applied once and carries through every future file, rather than being re-keyed each month.
Who signs off on the cost-centre coding?
A single named coding owner on the finance side is accountable for the GL account and cost-centre mapping. RadiusPoint proposes the mapping from your chart of accounts during onboarding, and your owner approves it, so accountability stays in-house.
How far before close should the file arrive?
Ideally before the close opens, so clean lines post early and exceptions get worked mid-close rather than at the deadline. The earlier the audited file lands, the less telecom shows up as a last-minute manual journal.
The Verdict
A TEM GL interface file is what lets a controller stop treating telecom as a monthly fire drill and start treating it as a subledger. Audited lines, pre-coded to your accounts and cost centres, post like everything else. Exceptions get accrued or held with specifics attached. The file balances to source and stays versioned, so the close is defensible. RadiusPoint builds that file from ExpenseLogic after a real line-item audit, which is the difference between posting numbers you trust and coding invoices you hope are right. If you’re evaluating whether a provider can deliver a genuinely GL-ready feed, the questions to ask a TEM provider are a good place to start.
Telecom Tax and Surcharge Audit: What Belongs on the Bill
By Sharon Watkins, Founder and CEO, RadiusPoint
Open a telecom invoice and almost every line below the plan rate wears the same official costume: a tax, a fee, or a surcharge with a government-sounding name. The quiet assumption in most accounts payable departments is that all of it is mandatory and none of it can be questioned. That assumption is where the money leaks.
Here is the direct answer. A telecom tax and surcharge audit checks each bill line against statute, tariff, and contract so finance pays only the charges that truly belong. Not every line labeled “tax” or “surcharge” is a statutory obligation. A real audit separates three things carriers print in one indistinguishable block: statutory taxes set by law, carrier surcharges permitted by a tariff or your contract, and discretionary fees a carrier chose to pass through. RadiusPoint runs that separation as a line-item audit inside ExpenseLogic, flagging what does not belong before the payment goes out, not months later in a recovery sweep.
This is audit guidance, not legal or tax advice. Jurisdiction rules differ and change, so the method below is about classification and proof, not a ruling on any specific statute.
Key takeaways
These points sum up how a telecom tax and surcharge audit separates mandatory charges from questionable ones and turns exceptions into recoverable credits for finance.
- Statutory taxes, permitted surcharges, and discretionary fees are three different classes. Treating them as one “tax” bucket is what hides recoverable errors.
- Contract language and jurisdiction rules decide what belongs. The label a carrier prints on the line is not proof.
- A line-item audit in ExpenseLogic lets RadiusPoint analysts challenge miscoded surcharges before the charge posts to the general ledger.
- Every dispute needs the account number, service ID, charge code, and billing period documented, so a credit can be proven to finance later.
The three charge classes hiding on every telecom invoice
Telecom invoices mix statutory taxes, carrier surcharges allowed by tariff or contract, and discretionary fees, and each class deserves its own audit test. Bundle them into a single “taxes and fees” total and you lose the ability to challenge the one class that is actually challengeable.
Statutory taxes are levied by federal, state, or local government. Federal excise tax, state and local telecom taxes, and E911 or 988 charges that fund emergency systems all sit here. They are set by law, they vary widely by jurisdiction, and a carrier cannot waive them.
Permitted carrier surcharges are cost-recovery line items a tariff or your signed contract authorizes. Some, like the Federal Universal Service Fund pass-through, are tied to a government program yet still applied at the carrier’s discretion in how much they recover and how. That discretion is exactly what makes them auditable.
Discretionary fees are the carrier’s own pricing decisions dressed in regulatory language. “Regulatory cost recovery,” “administrative fee,” and “cost assessment” lines usually fall here. They are not government taxes even though they share the block, and they are the first place a line-item invoice audit earns its keep.
| Charge class | What it IS | What it ISN’T |
|---|---|---|
| Statutory tax | A levy set by federal, state, or local law and remitted to a government body | Not negotiable and not waivable by the carrier |
| Permitted carrier surcharge | A cost-recovery charge a tariff or contract allows for a defined service | Not a government tax, even when the name is built to look like one |
| Discretionary fee | A carrier pricing decision passed through to the customer | Not mandated and not automatically owed just because it prints on the bill |
What “belongs on the bill” actually means
A charge belongs when law or the signed contract authorizes it for that service, jurisdiction, and period, and everything else is an exception worth challenging. “Belongs” is not a feeling about whether a fee looks official. It is a test with a yes or no answer for each line.
The failure mode is treating the invoice label as the authority. A line reading “state regulatory fee” is a claim by the carrier, not evidence the fee applies to your service type in your jurisdiction for the month billed. The proof lives in the statute, the carrier’s filed tariff, and your contract, not in the description field. RadiusPoint validates each line against the inventory of record and the contract inside ExpenseLogic, which turns a vague “that looks high” into a specific, defensible exception during a line-item telecom audit.
The Belongs Test: four questions before you pay
Run every questioned line through four questions. A “no” on any one of them makes the charge an exception to hold and document.
- Law: Does a federal, state, or local statute require this charge for this service? If it is a tax, you should be able to name the authority.
- Tariff: Is the surcharge in the carrier’s filed tariff at the rate and basis billed?
- Contract: Does your signed agreement permit this charge, or does it cap or exclude it?
- Service type: Does the charge match the actual service? Wireless, wireline, and data carry different rules, so a fee valid on one can be wrong on another.
How to run a surcharge audit without stalling accounts payable
Sample the high-variance charge codes first, hold only the disputed lines, and keep undisputed taxes moving so month-end close still finishes on time. An audit that freezes the whole invoice to argue over one surcharge creates more damage than the surcharge did.
The workable split is simple. Undisputed statutory taxes and clearly authorized surcharges flow through to payment on schedule. Only the questioned lines get held, ticketed, and worked. That keeps the AP cycle intact while the audit runs in parallel instead of in the critical path.
This is also where automation gets oversold. Three-way match confirms that an invoice ties to a purchase order and a receipt, but telecom tax and surcharge codes rarely map to a PO line, so the match passes them straight through. That gap is the whole reason invoice audit and three-way match are not interchangeable. Pair the PO-level control with a line-item audit that actually reads the tax and surcharge block.
The evidence pack that wins carrier disputes
Winning disputes cite the account number, service ID, invoice period, charge code, and the contract or tariff clause showing the surcharge does not apply. A carrier credits a documented exception far faster than an email that just says a fee looks wrong.
The pattern that wins is boring and repeatable: one exception, one packet, every field a carrier’s billing team needs to verify without a phone call. RadiusPoint files these directly with carriers under a letter of agency and tracks each pending credit in ExpenseLogic until it posts, the same discipline behind documented telecom refund recovery on client accounts.
Evidence Pack Template: the fields finance will accept
- Billing account number (BAN): the specific account, not just the carrier name.
- Service ID: the phone number, circuit ID, or meter tied to the charge.
- Invoice period: the exact billing month and invoice number.
- Charge code and label: the carrier’s own code plus the line description as printed.
- Amount and basis: what was billed and how it was calculated, per line or per rate.
- Authority tested: the statute, tariff section, or contract clause the Belongs Test failed on.
- Requested correction: the credit sought and the go-forward fix so the error does not reappear next cycle.
Where RadiusPoint fits in the tax and surcharge workflow
RadiusPoint audits every line in ExpenseLogic against inventory and contract so surcharge exceptions surface before payment, not after the books close. The point of a managed telecom tax and surcharge audit is not a one-time refund sweep. It is a monthly control that catches the same miscoded fee the first time it appears.
ExpenseLogic holds the rate table, the inventory of record, and the invoice history in one system, and validates invoice line items against contracted rates, provisioned services, and applicable tax treatment each billing cycle. RadiusPoint analysts work the exceptions, file the disputes, and update the inventory as moves, adds, changes, and disconnects happen, so a corrected surcharge stays corrected. It is the same line-item discipline RadiusPoint applies across telecom, wireless, and Utility Expense Management (UEM), which gives finance one reconciliation process instead of three.
The short version
Not every charge printed as a tax or surcharge is mandatory, so a telecom tax and surcharge audit exists to prove which lines truly belong. A telecom tax and surcharge audit sorts each line into statutory tax, permitted surcharge, or discretionary fee, tests it with four questions, and documents the exceptions so finance pays only what belongs. RadiusPoint runs that audit continuously inside ExpenseLogic, which is how a miscoded fee gets caught before payment instead of after the close.
Frequently asked questions
These are the questions finance and telecom teams ask most often when they start auditing telecom taxes and surcharges against contract and jurisdiction rules.
Are Universal Service and similar fees always legitimate?
Many are statutory or tariff-based, but the amount and whether they apply to your service type still need a line-level check. A fee funding a real government program can still be miscalculated or applied to the wrong service.
Should tax lines go through three-way match?
Three-way match alone rarely validates telecom tax codes, because those lines seldom tie to a purchase order or receipt. Pair it with a TEM line-item audit that reads the tax and surcharge block directly.
Who should approve surcharge write-offs?
Finance owns materiality and the write-off decision, telecom owns the carrier negotiation, and both should be recorded in the dispute ticket so the trail is clear later.
Do wireless and wireline follow the same surcharge rules?
They overlap in name only. Audit wireless and wireline under their own product and contract rules, because a surcharge that is valid on one can be wrong on the other.
Can spreadsheet filters catch bad surcharges?
Filters help you triage a single invoice, but sustained auditing needs charge-code history tied to inventory in a platform like ExpenseLogic. Otherwise the same miscode returns the next month and no one remembers the last dispute.
How to Build a Telecom Inventory of Record From Carrier CSRs
By Sharon R. Watkins, Founder and CEO, RadiusPoint
To build a telecom inventory of record, pull the Customer Service Records (CSRs) from each carrier, normalize the service IDs, map every line to a location and a cost center, then load a validated, versioned file into a system that can audit invoices against it. A CSR states what the carrier believes you subscribe to. Your inventory of record is the version your company trusts after that record has been validated, de-duplicated, and reconciled. At RadiusPoint we build that inventory inside ExpenseLogic first, so invoice audit finally has something true to match against.
Most teams build inventory in the wrong direction. They start from the invoice, because the invoice is the thing that shows up every month and demands payment. But an invoice is a summary. It rolls features into bundles, hides disconnected services that never stopped billing, and says nothing about the account that quietly vanished from the file. Reconcile a summary against itself and you confirm the summary. You don’t find the money. The carrier’s own record is where the truth lives, and building from it changes what the whole program can see.
Key Takeaways
- A Customer Service Record states what the carrier thinks you subscribe to. Your inventory of record is the version your company trusts after validation, de-duplication, and cost-center mapping.
- Build the inventory from CSRs first, then reconcile invoices to that file. Doing it the other way around just confirms the bill.
- Every inventory row needs a BAN, a service ID, a location, a cost center, and a contract rate before any audit can run against it.
- Duplicate and orphaned CSR lines are usually where disconnect savings and refund recovery start.
- RadiusPoint uses ExpenseLogic plus analyst review so CSR extracts become a maintained inventory, not a one-time spreadsheet dump.
Why Carrier CSRs Beat Invoices as Your Inventory Source
CSRs list the provisioned services and features that the invoice often summarizes away, so inventory should start from the carrier record, not the bill. An invoice is built to be paid, not to be audited. It groups charges, applies bundle pricing, and presents a total that clears accounts payable without ever exposing the line-level detail underneath.
A CSR is drawn from the carrier’s provisioning database. It shows the individual working telephone numbers, circuit IDs, features, and service order codes attached to a billing account number, including the ones the invoice has folded into a package or, worse, kept billing after the service was supposed to end.
| Question | What the invoice tells you | What the CSR tells you |
|---|---|---|
| What am I paying? | A bundled total per account | Every line item, feature, and surcharge separately |
| What do I actually have? | Only what is currently billed | Every service provisioned, including recently changed ones |
| Where is it installed? | A billing address, often a headquarters | The service location for each line or circuit |
| Is anything still billing that should be gone? | Nothing, the charge just looks normal | The service order codes that reveal a disconnect never completed |
This is why the inventory you assemble at the start of a program matters more than any dashboard you buy. The data gathered during onboarding becomes the reference every later audit depends on, and if it’s sourced from bills alone, every audit inherits the bill’s blind spots. Start from the carrier record and those blind spots have nowhere to hide.
If your inventory was built from invoices, you have a list of what you’re paying for. You still don’t have a list of what you have.
How to Turn CSRs Into an Inventory of Record: Five Steps
Pull the CSRs by BAN, normalize the service IDs, map locations and cost centers, then freeze a versioned inventory of record for audit. The build follows five steps in order, and the order is the point. Skip normalization and your map is unreliable. Skip validation and you version a file full of the carrier’s own errors.
- Pull. Request the full CSR for every billing account number, under a letter of agency, from each carrier in scope. Ask for the official service record, not a billing summary, because carriers will send the shorter document if you let them. A partial pull that covers some BANs but not others produces an inventory with holes you can’t see.
- Normalize. Carriers describe the same service in different formats, with different service order codes and different naming. Translate each carrier’s raw record into one consistent schema so a circuit from one carrier and a circuit from another sit in the same column with the same meaning.
- Map. Attach every line and circuit to a physical location and an owning cost center. This is where a raw carrier extract becomes something finance can use, because a service with no site and no cost center is a service nobody is accountable for.
- Validate. Reconcile the normalized, mapped records against invoices and against whatever internal inventory already exists. Flag every disagreement. Disagreements aren’t noise to be smoothed over, they’re the findings.
- Version. Freeze the reconciled file as a dated inventory of record and give it an owner. Every future change gets recorded against this version, so you always know what the inventory looked like when a given audit ran.
How long this takes depends mostly on how scattered the source data is, which is usually the real variable in a first build. Centralized billing shortens it. Invoices spread across accounts payable, IT, and individual site managers lengthen it. Either way, the five steps don’t change, only the effort at step one.
The Seven Fields Every Inventory Row Must Carry
Each inventory row needs a BAN, a service ID, a product code, a site, a cost center, a contract rate, and a status before ExpenseLogic can audit invoices line by line. A row missing any one of these can’t be fully audited, because each field answers a question the audit has to ask.
| Field | What it answers | Why the audit needs it |
|---|---|---|
| Billing account number (BAN) | Which account is this billed under? | Ties the row back to the invoice it should appear on |
| Service ID | Which specific line or circuit is this? | The unique key that matches invoice detail to inventory |
| Product code | What kind of service is it? | Determines which rate and tax treatment should apply |
| Site or location | Where is it installed? | Reveals services at closed or unowned locations |
| Cost center | Who owns the cost? | Allocates the charge and gives someone accountability |
| Contract rate | What should it cost? | The benchmark every billed charge is tested against |
| Status | Is it active, pending, or disconnected? | Catches services still billing after they were meant to end |
The contract rate field is the one most inventories omit, and it’s the one that turns a list into an audit. Without a rate to test against, you can confirm that a charge exists, but you can’t say whether it’s correct. It’s also the field that carries forward when you change providers, which is why an inventory built this way stays portable rather than trapped inside one vendor’s tool.
Where CSR-Based Inventory Builds Break Down
CSR builds fail when partial BAN pulls, stale feature codes, or unowned locations leave orphans that keep billing long after the site closed. The failure modes are consistent, and knowing them in advance is most of the defense.
- Partial BAN pulls. The team requests CSRs for the accounts it knows about and never discovers the accounts it doesn’t. A billing account nobody remembers is exactly the account most likely to be paying for something dead.
- Stale feature and service order codes. A CSR can carry codes for features and configurations that were changed years ago and never cleaned up. Loaded without interpretation, they inflate the inventory with services that don’t really exist in their billed form.
- Unowned locations. A line mapped to a site that closed, or to a site no cost center will claim, is an orphan. Orphans are where the money hides, because a charge nobody owns is a charge nobody questions.
- Format drift between carriers. Two carriers rarely format CSRs the same way. A build that assumes one layout will silently mis-parse the other, dropping or mislabeling rows.
Orphaned and duplicate lines aren’t only a data-quality problem. They’re usually the first dollars a program recovers, and finding them is the front end of telecom refund recovery. In one inventory clean-up, eliminating toll-free numbers that no longer routed anywhere returned $18,000 a year. In another, reconciling the inventory against the carrier’s records recovered $174,000 in re-credits. Those numbers don’t come from renegotiating anything. They come from having a true inventory to compare the bill against.
An orphan is a charge nobody owns. And a charge nobody owns is a charge nobody cancels.
How RadiusPoint Keeps the Inventory True After the First Load
RadiusPoint refreshes the inventory through MACD tickets and recurring CSR pulls inside ExpenseLogic, so the file stays current between audits instead of decaying the moment it’s built. An inventory of record is only true on the day you freeze it. Every move, add, change, and disconnect (the MACD activity that runs constantly in any live estate) starts pulling the file out of alignment with reality.
A one-time build ignores this and is stale within a quarter. RadiusPoint treats the inventory as a living file instead. Every MACD request is ticketed and written back to the inventory as it happens, and periodic CSR pulls re-confirm the carrier’s record against the file we maintain. Because ExpenseLogic holds the inventory, the rate table, and the invoice history in one place, each month’s audit runs against a current inventory rather than a snapshot from onboarding.
That continuity is what separates a managed program from a project. The same inventory that makes the first audit possible is the thing that keeps every later telecom audit honest, because the file the audit tests against was updated the day the service changed, not the day someone remembered to update a spreadsheet.
The Short Version
Build from the carrier’s record, not the bill. Pull every CSR, normalize the service IDs into one schema, map each line to a site and a cost center, validate against invoices, and freeze a versioned inventory with an owner. Give every row a BAN, service ID, product code, site, cost center, contract rate, and status. Then keep it alive with ticketed MACD and recurring CSR pulls. Do that, and the invoice finally has something true to be audited against. Skip it, and you’re auditing the bill against itself.
Frequently Asked Questions
Can we build a telecom inventory from invoices alone?
No, and it’s the most common mistake. Invoices show what you’re being charged, not what you have. They bundle line items, omit disconnected services that are still billing, and carry a billing address rather than a service location. An invoice-only inventory confirms the bill instead of testing it. Use the carrier’s Customer Service Records as the source, then reconcile the invoices to them.
How often should CSRs be refreshed?
Refresh on two triggers. First, on change: any move, add, change, or disconnect should update the inventory as it happens, through a ticket rather than from memory. Second, on a schedule: a periodic full CSR pull, commonly annual or semi-annual, re-confirms the carrier’s record against the file you maintain and catches anything that slipped between tickets. Estates with high turnover or frequent site changes need the scheduled pull more often.
What if two carriers format their CSRs differently?
They will, and that’s what the normalization step is for. Each carrier’s raw record gets translated into one consistent schema, so a circuit from one carrier and a circuit from another land in the same fields with the same meaning. This is exactly where builds that assume a single format break, because a parser tuned to one carrier’s layout will quietly mislabel another’s. Normalizing first is what makes a multi-carrier inventory trustworthy.
Who approves inventory changes?
A named owner, working from a defined approval workflow. Because every row carries a cost center, a change to that row has an accountable owner attached, and MACD activity flows through a ticket that records who requested the change and who approved it. The point of versioning the inventory is that no change is silent. You can always see what changed, when, and on whose authority.
How does this relate to switching TEM providers?
Directly. A properly built inventory of record is portable, which means it’s yours to carry to a new provider rather than something locked inside one vendor’s platform. The BAN, service ID, product code, site, cost center, contract rate, and status fields are provider-neutral. If you’re weighing a change, our guide to switching TEM providers without losing inventory covers how to move the file without losing the accuracy you paid to
What Is a Telecom BAN, and Why Finance Needs It on Every Invoice
By Sharon R. Watkins, Founder and CEO of RadiusPoint. Sharon founded the company in 1992 after a career in bank internal audit, and has spent more than three decades building the ExpenseLogic platform and reconciling carrier invoices against the accounts that generate them.
A billing account number, or BAN, is not a reference code you type into a carrier portal. It is the account identity a carrier bills under, and in telecom expense management the BAN is the one key that has to reconcile to three separate records at once: the invoice header, the customer service record from the carrier, and the inventory of services you actually run. When the BAN agrees across all three, your payables are auditable. When it does not, you get ghost payables, which is real money leaving the building against accounts nobody can tie back to a service.
Most finance and telecom teams never look at the BAN directly. They approve an invoice total, code it to a cost center, and pay it. The BAN sits quietly on the invoice header doing the one job nobody audits: deciding which account, and therefore which inventory, a charge belongs to. That works until a carrier migration, a merger, or an acquisition changes the BAN underneath a stream of charges that keeps arriving on the old schedule. Deciding whether to reconcile that yourself or hand it to a provider is a large part of knowing when you need a TEM program.
Key Takeaways
- The BAN is the account identity a carrier bills under. It sits above service IDs and should reconcile to the invoice header, the customer service record, and the inventory of record.
- A BAN is not a phone number, a circuit ID, an invoice number, or a remittance ID. Confusing the BAN with any of these is the root of most reconciliation errors.
- Ghost payables appear when a BAN is truncated on import, remapped after a merger, split across accounts payable vendors, inherited in an acquisition, or paid under a remittance ID that does not match the BAN.
- One location can hold several active BANs after adds, migrations, and acquisitions, so the inventory has to list every one.
- Loading each BAN as a controlled key, so every invoice, dispute, and general ledger file points to one account identity, is what keeps payables audit-ready.
How BANs relate to CSRs, invoices, and inventory
The BAN sits at the top of a hierarchy, and every other telecom identifier hangs beneath it. On the customer service record, the CSR the carrier maintains for your account, the BAN is the parent. Under it sit the service IDs: circuit IDs, billing telephone numbers, and mobile numbers, each one a service the carrier has provisioned. Undder each service ID sit the charge lines: the monthly recurring charge, usage, features, taxes, and surcharges. That chain, BAN to service ID to charge line, is the structure a real reconciliation follows.
The invoice header carries the BAN. The inventory of record carries the service IDs. Reconciling the header to the CSR and to the inventory, line by line rather than by sampling, is the core of invoice auditing services, and it is where the account identity has to hold. If the BAN on the invoice does not match a BAN in your inventory, the charge has nowhere to land and the audit stops before it starts.
BAN, service ID, invoice number, remittance ID: four identifiers people conflate
Four numbers travel together on a telecom account, and treating any two of them as interchangeable is how reconciliations break. Each names a different thing and changes on a different schedule.
| Identifier | What it names | Where it appears | How often it changes |
|---|---|---|---|
| Billing account number (BAN) | The account a carrier bills under | Invoice header, customer service record, contract | Rarely, until a migration, merger, or acquisition |
| Service ID (circuit ID, billing telephone number, mobile number) | One provisioned service under a BAN | Charge lines, inventory of record, CSR detail | Whenever a service is added, moved, or disconnected |
| Invoice number | One monthly bill document for a BAN | Invoice header only | Every billing cycle |
| Remittance ID | The payee identity accounts payable pays to | Vendor master, check or ACH file | Rarely, and set separately from the BAN |
One BAN groups multiple service IDs, so counting BANs tells you how many accounts you have, not how many services. The invoice number is disposable, new every cycle, and useless as a reconciliation key. The remittance ID is the one most likely to drift away from the BAN, because accounts payable sets it up for payment routing without reference to the carrier’s account structure. That gap is where the next section lives.
Common BAN failures that create ghost payables
A ghost payable is a charge that clears every month against an account you can no longer connect to a service. The money is real and the payment posts cleanly, which is exactly why nobody catches it: nothing bounces, nothing errors, the general ledger balances. The BAN is what failed, quietly, upstream. Five failure modes account for most of them, and a line-item telecom audit is built to surface all five.
| Failure mode | How it happens | Why it creates a ghost payable |
|---|---|---|
| BAN truncation | Leading zeros are dropped or account segments are cut when a BAN is keyed or imported into accounts payable or a spreadsheet | Charges post to a malformed account that reconciles to nothing in inventory |
| Post-merger remapping | A carrier merger or platform migration reissues BANs, and for a period both the retired and the new BAN bill | The old BAN keeps billing while inventory points only at the new one, so the old stream goes unwatched |
| Split across accounts payable vendors | The same carrier account is set up under two or more vendor records in accounts payable | One BAN pays through two remittance identities, so no single view ever reconciles the whole account |
| Acquisition split | BANs inherited through an acquisition are never folded into the inventory of record | Inherited accounts bill against an owner nobody tracks, often for years |
| Remittance versus BAN mismatch | The remittance ID accounts payable pays to is set separately from the BAN on the customer service record | Payment clears but never ties back to a service, so the charge cannot be audited or disputed |
The last two are the most expensive because they hide the longest. After an acquisition, the inherited estate arrives without a clean inventory, and the BANs that came with it bill against no clear owner until someone reconciles them deliberately. A remittance versus BAN mismatch is worse still: the payment side looks healthy, so the mismatch never raises an exception. Both need the same fix, which is a single inventory owner who holds the authoritative list of active BANs and reconciles every remittance back to it.
A ghost payable never bounces. It clears, it balances, and it bills again next month. That is why it survives.
How RadiusPoint and ExpenseLogic keep BANs audit-ready
RadiusPoint loads every BAN into ExpenseLogic as a controlled key, so each invoice, each dispute, and each general ledger file points to one account identity rather than to whatever string happened to be typed that month. Once the BAN is controlled, the hierarchy underneath it becomes testable: every service ID maps to a BAN, every charge line maps to a service ID, and every payment maps back to the BAN it settled. When a carrier reissues a BAN in a migration, the old and new identities are linked in the platform rather than left to drift, so the retired account cannot keep billing unnoticed.
This is where the software-plus-people model matters. The platform holds the controlled keys and the rate table; RadiusPoint analysts do the reconciling work that keeps them true, validating every invoice line item against the inventory of record each billing cycle instead of sampling a few. RadiusPoint captures and validates every BAN, alias, and account number during onboarding and data collection, which is the step that decides whether the rest of the program reconciles or guesses. In one client estate, correcting the inventory of record recovered $174,000 in re-credits that had been sitting behind mismatched accounts.
Every month a BAN stays uncontrolled is another cycle of the same charges posting against an account nobody can audit. Ask RadiusPoint to reconcile one carrier’s BANs against your inventory of record, and you will see how many of your payables point at a service and how many point at a ghost.
Frequently Asked Questions
Is a BAN the same as a phone number or circuit ID?
No. A phone number, a billing telephone number, and a circuit ID are service identifiers that sit under a BAN, and one BAN can hold multiple of them. The BAN names the account; the service IDs name the individual services the carrier has provisioned on that account.
Who owns BAN accuracy, accounts payable or telecom?
Both, on different sides of the same number. Telecom owns inventory truth, meaning which services exist under which BAN. Accounts payable owns payment posting, meaning which BAN a payment settles against. They need the same BAN to agree, which is why a single inventory owner and a shared account list matter more than which department holds them.
What if a carrier uses an account number instead of a BAN?
Treat the account number as the BAN equivalent. Some carriers, particularly wireless and utility providers, label the field differently. Document the alias against the account in ExpenseLogic so the account number, the BAN, and any legacy identifier all resolve to one controlled key rather than three that look unrelated.
Can one location have multiple BANs?
Yes, and it is common. Adds, carrier migrations, and acquisitions all create new BANs for a site that already had one, so a single location can carry several active BANs at once. The inventory of record has to list every active BAN for the location, or charges under the unlisted ones become ghost payables.
Does wireless use BANs too?
Yes. Wireless bills roll up to a master account number that functions as the BAN, with individual mobile numbers as the service IDs beneath it. Map wireless the same way you map wireline: master account number as the controlled key, mobile numbers reconciled against an employee or cost center directory underneath it.
What Do You Lose When You Switch TEM Providers?
By Sharon Watkins, Founder and CEO, RadiusPoint · 31 August 2026 · 12 min read
When you switch telecom expense management providers you can lose the inventory of record, open disputes, unposted credits, letters of agency, and current customer service records, unless you export them before access ends. A TEM contract ending is not a software logout. RadiusPoint rebuilds a working inventory in ExpenseLogic from those five files plus fresh carrier records, not from a portal you can no longer open.
This page is the switch process.
Key Takeaways
- The five things that walk out with the old provider are inventory, open disputes, the credit pipeline, letters of agency, and carrier customer service records (CSRs).
- Inventory work at RadiusPoint has recovered $174,000 in re-credits when the record of services did not match the bill. That file is what you are trying not to lose.
- A Fortune 100 manufacturer working with RadiusPoint recovered $450,000 in telecom refunds in year one. Unposted disputes of that kind die if nobody owns them during the gap.
- The Switch-Safe Handoff is four moves: export first, re-request CSRs, reissue letters of agency, then park open credits.
- Notify the incoming provider and start the export before you tell the outgoing provider the access date.
The Short Version
Export the inventory of record, the dispute register, and the credit log while you still have login rights, then re-request CSRs and reissue letters of agency, before anyone cuts the old portal.
In this article
- The five things that walk out with the old provider
- What happens to open disputes and credits during a TEM switch?
- How do you keep the inventory of record when you change providers?
- Letters of agency and customer service records have to be reissued
- The Switch-Safe Handoff
- When should you notify the old provider versus the new one?
- How RadiusPoint rebuilds a working inventory instead of importing a stale one
The five things that walk out with the old provider
The five things that walk out with the old TEM provider are inventory, open disputes, credits, letters of agency, and CSRs. RadiusPoint asks for those five before ExpenseLogic is treated as live. A TEM platform can hold years of tickets you never copied. When the login dies, the tickets die with it.
Recovery is only as durable as the register you carry across the gap. A glass manufacturer working with RadiusPoint saved $100,000-plus in year one. Those dollars started as line items someone could still see.
This is a process page. It does not rank providers. If you need a commercial starting point after the handoff, the telecom expense management service is that page.
What happens to open disputes and credits during a TEM switch?
Open disputes stall, and unposted credits expire, unless a named owner keeps the evidence pack and the carrier ticket number alive through the gap. RadiusPoint parks that register in ExpenseLogic and will not call a credit “saved” until it appears on a later invoice. Identified dollars are not banked dollars. A switch that reports “$400,000 identified” and then drops the follow-up has converted recovery into a story.
A Fortune 100 manufacturer recovered $450,000 in telecom refunds in year one, with $850,000 in ongoing annual savings and a $1.3 million year-one impact. That pipeline had an owner. Invoice auditing services find the error. Telecom audit services keep the audit moving. Neither page replaces a dispute register you forgot to export.
Ask the outgoing provider for a list of every open ticket, the amount, the carrier reference, and the last follow-up date. If they cannot produce it, assume the pipeline is already at risk.
How do you keep the inventory of record when you change providers?
You keep the inventory of record by exporting it while you still have rights, then reconciling that file to a fresh CSR. RadiusPoint treats the outgoing export as a hypothesis in ExpenseLogic. The CSR is the carrier’s current picture. The next invoices are the proof. Inventory management at RadiusPoint has recovered $174,000 in re-credits when those pictures disagreed.
An inventory export that lacks service ID, BAN, carrier, contract, location, cost centre, monthly rate, status, last invoice date, and open-ticket reference is a contact list. It is not an inventory of record. RadiusPoint will say which fields are missing rather than load a false baseline.
Multi-vendor support is the live reminder that each carrier is a separate export and a separate CSR request. One “download all” button is rare.
Letters of agency and customer service records have to be reissued
Letters of agency have to be revoked and reissued, and customer service records have to be requested again from each carrier. Customer service records have to be requested again from each carrier. RadiusPoint will not reuse an outgoing provider’s letter, and ExpenseLogic will not treat a six-month-old CSR as current. The grant is personal to the agent. Copying a PDF does not transfer authority.
This is not a second letter-of-agency explainer. It is the switch step: revoke the old grant so two agents are not writing the same carrier, then issue a scoped grant to the incoming team. CSR timing sits on the carrier, not on your preferred go-live date.
If utilities are in scope, Utility Expense Management (UEM, not Unified Endpoint Management) needs the same revoke-and-reissue pattern on utility accounts. RadiusPoint can hold those grants on the same ExpenseLogic instance. They are still different vendors.
The Switch-Safe Handoff
The Switch-Safe Handoff is RadiusPoint’s four-move sequence: export first, re-request CSRs, reissue letters of agency, then park open credits with a named owner. ExpenseLogic is where those four outputs land. Exit blogs in this category say “collect invoices and tell your vendors.” They do not teach a four-move order that delays notice to the outgoing provider until the export is in motion.
| Move | What you take | What fails if you skip it |
|---|---|---|
| 1 Export first | Inventory, dispute register, credit log, contract images | The portal closes and the history goes with it |
| 2 Re-request CSRs | A current carrier record per vendor | You import a stale extract as truth |
| 3 Reissue LOAs | Revoke old grant, issue scoped new grant | Two agents, or no agent, talk to the carrier |
| 4 Park open credits | Owner, amount, ticket ID, last follow-up | Identified dollars never post |
When should you notify the old provider versus the new one?
Notify the incoming provider first, start the export, then give the outgoing provider a dated access-end notice that still leaves time to pull files. RadiusPoint would rather see a complete pack than an early announcement. A provider who loses the account can still behave professionally. Do not test that by cutting access the same day you send the email.
Read the current contract for notice periods and auto-renewal. That is a calendar fact, not a vendor review. RadiusPoint will work to your notice date. ExpenseLogic still needs the four Switch-Safe outputs inside that window.
If the outgoing team offers a “transition file,” take it, then still re-request CSRs. Their file is their picture. The carrier’s CSR is the picture the next invoice will be billed from.
How RadiusPoint rebuilds a working inventory instead of importing a stale one
RadiusPoint rebuilds the inventory in ExpenseLogic by matching your export to new CSRs and to the next invoices, then opening exceptions where the three disagree. Importing a stale file and calling it go-live is how ghost circuits survive a switch. Analysts file new disputes under the new letter of agency. Old tickets stay in the parked register until they post or are written off with a reason.
The glass manufacturer case is a savings story after the record was usable. HumanGood’s published 315% ROI is a running-program figure. Neither number appears during a messy cutover.
RadiusPoint has done this since January 1992. ISO 9001 certification has been in place since September 2002. Amalgam Insights named RadiusPoint a Distinguished Vendor on the 2024 TEM Vendor SmartList. The Capterra listing sat at 4.8 from 31 reviews through December 2025. Sharon Watkins founded the firm after internal-audit work at a bank. A TEM switch is an audit handoff with a cancellation email attached.
FAQ
Can we run two TEM providers at once during the gap?
You can, if letters of agency are scoped so only one agent can order, and both can read bills. RadiusPoint will say which rights it needs. Two agents filing the same dispute is how credits get lost.
What if the old provider will not export inventory?
Start with carrier CSRs and the last 12 months of invoices. RadiusPoint will rebuild from those in ExpenseLogic. The $174,000 re-credit case is what a rebuild can still find. You will spend more calendar time.
Do we need to re-sign every letter of agency?
Yes, or execute a revoke-and-replace that the carrier will accept. A forwarded PDF of the old letter is not a grant to the new agent.
Is this the same as the Day-Zero pack for a first-time TEM buyer?
No. First-time onboarding gathers your internal files. A switch also has to extract files that live inside the outgoing platform and keep the credit pipeline alive. Overlap exists. The risk is different.
What if we are only switching the software and keeping the same people?
You still need the export and the CSR refresh. People remember tickets. Portals do not migrate memory. RadiusPoint will still reconcile the file to the next invoice.
What to do before you give notice
List the five files. Pull the ones you can download today. Call RadiusPoint with that list and the notice date on the current contract. ExpenseLogic can start on a partial export. It cannot start after the portal is already dark.
References
- Telecom Expense Management Services | RadiusPoint
- Telecom Refunds, Cost Avoidance, Savings | RadiusPoint
- Invoice Auditing Services | RadiusPoint
- Telecom Audit Services | RadiusPoint
- Multi-Vendor Support | RadiusPoint
- Glass Manufacturer Saves $100K on Telecom Expenses | RadiusPoint
- HumanGood Achieved 315% ROI with RadiusPoint | RadiusPoint
- RadiusPoint Recognized as a Distinguished Vendor in the 2024 Amalgam Insights Vendor SmartList | RadiusPoint
- ExpenseLogic reviews | Capterra
- Sharon R. Watkins | RadiusPoint
- ExpenseLogic | RadiusPoint
Related articles
- Telecom Expense Management Services
- Telecom Refunds and Cost Avoidance
- Invoice Auditing Services
- Telecom Audit Services
Disclaimer
This article is general information for teams changing TEM providers. It is not legal advice on contracts, notice periods, or letters of agency. Outcomes cited are from specific RadiusPoint client engagements already in RadiusPoint’s published case studies and are not a guarantee of future results or of a cutover duration.
The Data a TEM Provider Needs Before Day One
By Sharon Watkins, Founder and CEO, RadiusPoint · 30 August 2026 · 12 min read
A telecom expense management provider needs invoices, contracts, a starter inventory, allocation rules, an employee roster, and site open-and-close dates before the first cycle, and a letter of agency is only one file in that pack. Accounts payable emails three PDFs and calls it kickoff. RadiusPoint cannot build an inventory of record in ExpenseLogic from three PDFs. Day one is the day the pack is complete enough to load, not the day the contract is countersigned.
This page is onboarding-readiness.
Key Takeaways
- The Day-Zero Data Pack is eight files: scoped letters of agency, invoice history, contracts, starter inventory, GL and allocation rules, HR roster, site dates, and named owners.
- A letter of agency authorizes carrier conversations. It does not create invoices, rate tables, or an employee list.
- A food service onboarding at RadiusPoint needed two months for users to register 600-plus lines. Fifty-six of those users were already gone.
- HumanGood, a named RadiusPoint client, has a published 315% ROI once the program is running. That figure is not a substitute for a complete kickoff pack.
- Kickoff stalls when IT is asked for every file. AP, procurement, finance, HR, and real estate each own a slice.
The Short Version
Before RadiusPoint can run ExpenseLogic on your accounts, you need a Day-Zero Data Pack: invoices, contracts, a starter inventory, allocation rules, an HR roster, site dates, named owners, and a scoped letter of agency, not the letter alone.
In this article
- What a TEM provider can start without, and what it cannot
- Why is a letter of agency not the onboarding file?
- Which invoice, contract, and inventory files should be ready first?
- What finance and HR have to contribute before kickoff
- The Day-Zero Data Pack
- Who inside your company owns each file?
- How RadiusPoint uses ExpenseLogic once the pack arrives
What a TEM provider can start without, and what it cannot
A TEM provider can start a RadiusPoint kickoff call without a perfect inventory, but it cannot validate invoices without bills. RadiusPoint still needs a rate source and a way to reach the carrier. RadiusPoint will load what you have into ExpenseLogic and mark the gaps. A missing contract exhibit delays rate matching. A missing letter of agency delays portal access. A missing site list delays allocation. Those are different delays.
The telecom expense management service names monthly accrual files and GL interface files as outputs. Outputs require inputs. This page is the input list. The TEM FAQ answers how the platform behaves after load. Do not treat the FAQ as the pack.
You can begin without 36 months of history. You should not begin without at least one full recent cycle per major carrier and the current contract that is supposed to govern it.
Why is a letter of agency not the onboarding file?
A letter of agency authorizes a TEM provider to speak to a named carrier on a scoped set of rights only. It is not the onboarding file. RadiusPoint still needs invoices, contracts, and owners after the letter is signed, and ExpenseLogic will not invent those records from the authorization. Scope the letter. A read-only billing grant is not ordering rights. A blanket grant is a governance problem, which the live TEM pillars already warn against.
This section names the letter so you do not confuse it with the pack. It is not a second letter-of-agency article. If you want the legal mechanics of the grant, that is a different page. If you want to know what to gather this week, stay here.
RadiusPoint will tell you which carrier the letter must name and which rights it must include. You still have to produce the other seven files.
Which invoice, contract, and inventory files should be ready first?
Ready first means 12 months of invoices or portal access, current contracts, and the best inventory you already have on file. RadiusPoint loads those three into ExpenseLogic before it asks for a polished spreadsheet. Invoice audit work cannot start on a carrier you have not shown. Contract images are the rate table. The starter inventory is a hypothesis the bills will test.
A food service client had no wireless procurement policy and no structure for adding users. RadiusPoint stood up a Register Your Line portal and spent two months collecting registrations on 600-plus lines. That timeline is published on the managed mobility case study. The pack was incomplete on purpose. The invoices and the portal still had to exist on day one.
Telecom lifecycle management is the live companion for how services move after kickoff. This question is only about the files that have to exist before that lifecycle has a baseline.
What finance and HR have to contribute before kickoff
Finance has to contribute the chart of accounts, cost-centre list, and allocation rules before RadiusPoint can code ExpenseLogic files. HR has to contribute a current employee roster for wireless matching. RadiusPoint cannot code a GL interface file in ExpenseLogic without the map finance already uses, and it cannot flag a departed user without a roster dated in the same month as the wireless bill. Those two files are why kickoff is not an IT-only request.
The food service case found 56 identified users who were no longer employed. That finding required a roster, not only a carrier extract. HumanGood’s published 315% ROI is a running-program figure. It does not appear until allocation and inventory have something to post against.
If finance plans to copy last month’s bill for the accrual, say so. RadiusPoint will then know the accrual file is part of the pack, not a later enhancement.
The Day-Zero Data Pack
The Day-Zero Data Pack is RadiusPoint’s eight-file list of what has to be present, even if incomplete, before ExpenseLogic can run a first cycle. Implementation guides in this category say “send us your invoices and an LOA.” They do not name an eight-file pack with an owner for each file.
| Code | File | Minimum that unblocks day one |
|---|---|---|
| A | Scoped letters of agency | One per carrier, rights named, revoke path named |
| B | Invoice history or portal access | Latest 12 months, or a live feed, for each major vendor |
| C | Contracts and amendments | Current rate exhibits, not only the cover page |
| D | Starter inventory | Circuits, lines, BANs, and locations you already know |
| E | Finance map | Chart of accounts, cost centres, allocation rules |
| F | HR roster | Active employees for wireless matching |
| G | Site list | Open and closed locations with dates |
| H | Named owners | AP, IT, procurement, and an approver |
Who inside your company owns each file?
IT or telecom owns the inventory, BANs, circuit IDs, and portal logins that RadiusPoint will load into ExpenseLogic. Accounts payable owns invoice PDFs and the vendor master. Procurement owns contracts. Finance owns the GL map. HR owns the roster. Real estate or facilities owns site dates and, if utilities are in scope, the utility account list. RadiusPoint will send one request list. Your internal owners still have to move the files.
That environment makes file H (named owners) non-negotiable. A single inbox labeled “TEM kickoff” will sit.
Utility Expense Management (UEM, not Unified Endpoint Management) adds meter IDs and tariff sheets to files B, C, and G. RadiusPoint can load those on the same ExpenseLogic instance. They are still different owners inside your company.
How RadiusPoint uses ExpenseLogic once the pack arrives
RadiusPoint loads the pack into ExpenseLogic, builds a baseline inventory from bills plus your starter file, and opens exceptions where the two disagree. Analysts then validate lines, file disputes where authorized, and return an allocation file that matches the finance map you sent. You do not receive a portal with empty tables and a note to “upload more later” as if that were go-live.
RadiusPoint has done this since January 1992. ISO 9001 certification has been in place since September 2002. Amalgam Insights named RadiusPoint a Distinguished Vendor on the 2024 TEM Vendor SmartList. The Capterra listing sat at 4.8 from 31 reviews through December 2025. Credentials do not shrink the pack. They tell you the load process is repeatable.
Sharon Watkins founded RadiusPoint after internal-audit work at a bank. Day-zero data is an audit binder. ExpenseLogic is where that binder becomes the inventory of record.
FAQ
Can we start if our inventory spreadsheet is two years old?
Yes, if invoices and contracts are current. RadiusPoint will treat the spreadsheet as a hypothesis in ExpenseLogic and rebuild against the bills. Mark file D as stale so nobody pretends it is the inventory of record.
Do we need portal passwords or only PDFs?
PDFs can start a historical load. Portal or EDI access is what keeps the next cycle arriving without a mailbox chase. RadiusPoint will say which carriers still require a human upload.
What if HR will not release a roster?
Wireless matching will be incomplete. RadiusPoint can still process wireline invoices. File F stays red on the pack until HR sends a dated active list, even if names are limited to employee ID.
Is this the same as the data we send when we switch providers?
No. Switching is a handoff out: export, open disputes, reissued letters, carrier CSRs. This page is a handoff in: the first pack a new provider needs. Overlap exists. The jobs are different.
How complete does file G need to be on day one?
Every location you know is still open or that closed in the last 12 months, with a date. RadiusPoint will catch more from the bills. A blank site list makes every invoice a mystery BAN.
What to do before kickoff
Assign an owner to each of the eight codes this week. Send RadiusPoint the files you have, and label the files you do not. ExpenseLogic can start on a partial pack. It cannot start on a letter of agency and a promise.
References
- Telecom Expense Management Services | RadiusPoint
- Telecom Expense Management FAQ | RadiusPoint
- Invoice Audit | RadiusPoint
- Telecom Lifecycle Management | RadiusPoint
- Multi-Vendor Support | RadiusPoint
- How Managed Mobility Services Cut Costs 22% ($400K in Year 1) | RadiusPoint
- HumanGood Achieved 315% ROI with RadiusPoint | RadiusPoint
- RadiusPoint Recognized as a Distinguished Vendor in the 2024 Amalgam Insights Vendor SmartList | RadiusPoint
- ExpenseLogic reviews | Capterra
- Sharon R. Watkins | RadiusPoint
- ExpenseLogic | RadiusPoint
Related articles
- Telecom Expense Management Services
- Telecom Expense Management FAQ
- Invoice Audit
- Telecom Lifecycle Management
Disclaimer
This article is general information for teams preparing a TEM kickoff. It is not legal advice on letters of agency or data-sharing. Outcomes cited are from specific RadiusPoint client engagements already in RadiusPoint’s published case studies and are not a guarantee of future results or of a kickoff duration.
Signs Your Company Has Outgrown Managing Telecom In-House
By Sharon Watkins, Founder and CEO, RadiusPoint · 29 August 2026 · 12 min read
You need a telecom expense management provider when your team can no longer produce a complete inventory this week, invoices are approved without a line-item check, and contracts renew without a rate review. How many mobile lines does your company pay for right now? Not approximately. Exactly. Most in-house owners cannot answer inside five business days. That gap is the sign. RadiusPoint takes the operational load on ExpenseLogic while you keep the budget.
This page is a readiness self-assessment.
Key Takeaways
- The first sign you have outgrown in-house TEM is an inventory you cannot finish this week, with a location, a cost centre, and a contract rate on each service.
- A food service company working with RadiusPoint had 600-plus lines, one overloaded owner, and 56 departed users still billing. Monthly cost fell 22%, more than $400,000 in year one.
- Amalgam Insights’ IT Rule of 30 states that the average unmanaged IT expense category is wasting 30% in spend, a category claim, not a RadiusPoint promise (EIN Presswire, 2024).
- Organizations implementing TEM typically see 15 to 30 percent cost reduction in year one. Treat that as a category range, not a guarantee.
- The Outgrown-In-House Scorecard is six operational signs. Three or more yes answers is a staffing problem.
The Short Version
If your team cannot name every circuit, mobile line, and data service this week, you have already outgrown in-house telecom expense management, whether or not you still have a “telecom person.”
In this article
- The inventory question your team should answer this week
- What happens when invoices get approved without a line-item check?
- How carrier and location count turns a spreadsheet into a leak
- What happens when telecom contracts renew without a review?
- The Outgrown-In-House Scorecard
- Does a dedicated telecom person still mean you can stay in-house?
- How RadiusPoint and ExpenseLogic take the operational load
The inventory question your team should answer this week
The inventory question is exact headcount of circuits, mobile lines, and data services, each with a location, a cost centre, and a contract rate. RadiusPoint treats that file as the inventory of record inside ExpenseLogic. A spreadsheet that is 90 days old is a memory. It is not an inventory. The telecom expense management FAQ is where buyers ask how the platform holds that file. This page asks whether you can produce it at all.
A food service company came to RadiusPoint with hundreds of wireless devices and no identification of the employees using them. The managed mobility case study records 600-plus phones billed monthly, 56 users no longer employed, and a 22% monthly-cost cut that the video transcript states as more than $400,000 a year. That is what “we are handling it in-house” looked like with one person who also had other duties.
If you cannot answer the inventory question this week, the rest of the scorecard is already in motion.
What happens when invoices get approved without a line-item check?
Invoices approved without a line-item check become paid vendor claims, including charges for services that no longer exist at all. RadiusPoint audits invoice lines against contracted rates and inventory in ExpenseLogic before the payment run. Rubber-stamp approval is the quiet version of in-house failure. The due date is real. The GL coding is complete. The circuit may have been dead for a year.
RadiusPoint published $18,000 a year recovered by eliminating unneeded toll-free numbers. Inventory work has recovered $174,000 in re-credits when the record of services did not match the bill. A Fortune 100 manufacturer recovered $450,000 in telecom refunds in year one. Those dollars sat on invoices someone had already been allowed to pay. Facing five TEM challenges names the operational pressure. This page names the sign: approval without a line check.
Carrier dispute windows are finite. An invoice reviewed 60 days late is often a permanent write-off. That is an in-house capacity problem, not a software preference.
How carrier and location count turns a spreadsheet into a leak
Complexity, not a round spend number, is usually what outgrows a part-time telecom owner that RadiusPoint still sees monthly. RadiusPoint sees the break when a second and third carrier land, then when sites open and close faster than MACD tickets close. One carrier and one site can still fit a careful analyst. Three carriers plus wireless plus utilities will not, if that analyst also owns help desk and hardware refresh.
RadiusPoint published a client that grew from 170 to 1,200 locations. At that scale, a missed disconnect on a thin percentage of sites is not a rounding error. ExpenseLogic holds telecom, wireless, and utility invoices together so the same owner problem does not hide in three spreadsheets. Cutting telecom expenses with TEM is the commercial companion. This section is the complexity test.
An automotive-salvage engagement on the live TEM page generated $1.3 million from inventory and audit after acquisitions consolidated invoices. That is what a location-count jump looks like when nobody rebuilds the record.
What happens when telecom contracts renew without a review?
A telecom contract that auto-renews at the old rate is an unowned calendar RadiusPoint sees every month, not a market decision. RadiusPoint tracks expiration dates and rates against service IDs in ExpenseLogic and raises the date before the notice window closes. In-house teams lose that date because the person who signed the deal left, or because the file lives in a procurement inbox no one opens.
Silent renewal is one of the six scorecard signs. It pairs with departed employees who still have live mobile lines, which is the wireless face of the same ownership gap. The food service case had both: no wireless policy, and users who had been gone more than two years while billing continued. RadiusPoint wrote the policy after the inventory, not before.
What Is Telecom Expense Management? explains the discipline. This page asks whether anyone on your payroll still practices it every month.
The Outgrown-In-House Scorecard
The Outgrown-In-House Scorecard is RadiusPoint’s six-sign test of whether one internal owner can still finish the work each month. ExpenseLogic is where RadiusPoint would take those six jobs if the score is already failed.
| Sign | Yes looks like | What RadiusPoint loads into ExpenseLogic |
|---|---|---|
| 1 Incomplete inventory | No exact service count this week | Circuits, lines, BANs, locations, rates |
| 2 Unread approvals | AP pays on due date and coding only | Line-item match to contract and inventory |
| 3 Carrier and site sprawl | Three-plus carriers or a rising site count | Multi-vendor invoices on one record |
| 4 Silent renewals | A term date nobody calendared | Contract IDs and notice windows |
| 5 Ghost mobility | Departed staff still have live lines | Employee roster versus wireless inventory |
| 6 Accrual from last month’s bill | Finance copies the prior invoice | Missing-bill and accrual support files |
Three or more yes answers is a staffing problem. Buying a dashboard without moving the work does not clear a yes.
Does a dedicated telecom person still mean you can stay in-house?
A dedicated person can keep TEM in-house if they still finish inventory, line checks, and renewals without dropping the accrual. RadiusPoint does not treat a job title as proof of capacity. The food service owner was dedicated to phones and still had other telecom duties. The lines outran the person.
Stay in-house when the scorecard is mostly no, the carrier mix is simple, and finance already trusts the accrual. Move the operational work when three or more signs are yes. This question only tests whether the person you already have can still see the file.
A healthcare provider working with RadiusPoint reduced telecom expenses 26%. A glass manufacturer saved $100,000-plus in year one. Those are program outcomes after the work moved. They are not a rule that every titled telecom manager must outsource.
How RadiusPoint and ExpenseLogic take the operational load
RadiusPoint takes invoice collection, line-item audit, dispute filing, and inventory maintenance onto ExpenseLogic, and leaves budget approval and carrier strategy with you. The telecom expense management service is that model. You still own the yes or no on a disconnect. RadiusPoint owns proving the charge is gone.
Amalgam Insights named RadiusPoint a Distinguished Vendor on the 2024 TEM Vendor SmartList. The same 2024 release cycle is where Amalgam published the IT Rule of 30: the average unmanaged IT expense category is wasting 30% in spend. Use that as a category warning. Do not write it as a RadiusPoint guarantee. Organizations implementing TEM typically see 15 to 30 percent cost reduction in year one, again a category range.
RadiusPoint has done this since January 1992. ISO 9001 certification has been in place since September 2002. The Capterra listing sat at 4.8 from 31 reviews through December 2025. Sharon Watkins founded the firm after internal-audit work at a bank. The outgrown-in-house problem is an audit problem with a headcount attached.
FAQ
Is there a spend number that means we must outsource?
No honest operator can name one number that fits every carrier mix. RadiusPoint starts with the six signs. A simple single-carrier environment can stay in-house at a higher spend than a messy multi-carrier one at a lower spend.
Does a TEM platform without managed service fix a failed scorecard?
Only if you staff the work the platform reports. RadiusPoint’s model is software plus people. A license that leaves disputes and inventory with a team that already failed the scorecard is a reporting layer over the same leak.
What if we only failed the mobility signs?
Start with wireless inventory and the HR roster. The food service case was a mobility failure that sat next to a TEM failure. RadiusPoint can take one expense category first. The scorecard still applies to that category.
Can we run the scorecard on utilities too?
Yes, with Utility Expense Management (UEM, not Unified Endpoint Management) substituted for TEM on the invoice type. RadiusPoint holds both on ExpenseLogic. A closed-site electric bill is the utility face of sign 1 and sign 3.
What to do before the next invoice cycle
Score the six signs this week. If you cannot name the inventory, stop there and call that a yes. RadiusPoint will load one month of invoices into ExpenseLogic and show you which signs are already costing you. Every cycle you skip is another unread approval.
References
- Outsourced Telecom Expense Management | RadiusPoint
- What Is Telecom Expense Management? | RadiusPoint
- Telecom Expense Management Services | RadiusPoint
- Telecom Expense Management FAQ | RadiusPoint
- How Managed Mobility Services Cut Costs 22% ($400K in Year 1) | RadiusPoint
- Facing Five TEM Challenges | RadiusPoint
- Cutting Telecom Expenses with TEM | RadiusPoint
- Amalgam Insights Unveils Vendor SmartList for Telecom Expense Management | EIN Presswire
- RadiusPoint Recognized as a Distinguished Vendor in the 2024 Amalgam Insights Vendor SmartList | RadiusPoint
- ExpenseLogic reviews | Capterra
- Sharon R. Watkins | RadiusPoint
Related articles
- Outsourced Telecom Expense Management
- What Is Telecom Expense Management?
- Telecom Expense Management Services
- Managed Mobility Services case study
Disclaimer
This article is general information for finance and IT leaders deciding whether in-house TEM still fits. It is not a staffing or legal recommendation. Outcomes cited are from specific RadiusPoint client engagements already in RadiusPoint’s published case studies. Category-level ranges, including Amalgam’s IT Rule of 30 and the 15 to 30 percent TEM range, are not RadiusPoint guarantees.
Questions to Ask a TEM Provider Before You Sign
By Sharon Watkins, Founder and CEO, RadiusPoint · 28 August 2026 · 12 min read
The questions that belong in a telecom expense management contract are the ones that name a person, a percentage, and a file you will receive if you leave. Most buyers treat the TEM demo as the evaluation. RadiusPoint treats the statement of work as the evaluation. A platform can show you a variance. A managed service has to say who files the dispute, who updates the inventory, and who hands you the export on the last day.
This page is the pre-sign question list.
Key Takeaways
- Ask who files the carrier dispute and who confirms the credit on a later invoice. A report is not a recovery.
- Ask what share of invoice lines is audited against the contracted rate table, not what share is loaded into the tool.
- Ask how the inventory of record is built, and in what format you receive it if the engagement ends.
- A food service client working with RadiusPoint on 600-plus lines cut mobility cost 22% and more than $400,000 in year one after 56 departed users were still being billed.
- The Sign-Day Seven is RadiusPoint’s list of questions that have to survive into the contract, not only into the sales deck.
The Short Version
Before you sign a TEM agreement, write seven answers into the statement of work: who files, what share of lines is audited, how inventory is exported, what the letter of agency covers, which pricing model you are buying, who the named analyst is after go-live, and what files you receive on the last day.
In this article
- The questions that belong in the contract, not the demo
- Who files the dispute when an invoice is wrong?
- What percentage of invoice lines will you actually audit?
- How will we get our inventory of record if we leave?
- The Sign-Day Seven
- Which pricing model are you buying, and what does it reward?
- How RadiusPoint answers these questions in a managed TEM engagement
The questions that belong in the contract, not the demo
The questions that belong in a TEM contract are the ones a RadiusPoint demo, or any demo, can dodge with a screenshot. RadiusPoint writes those questions into ExpenseLogic’s operating model so a buyer can test the answer after month three, not only on the sales call. “We audit invoices” is demo language. “What percentage of lines, against which rate table” is contract language. The vendor evaluation page on the RadiusPoint site is the commercial companion. This page is the script you take into the room.
This page assumes you already know what TEM is and you are about to sign.
A letter of agency, an inventory export, and a dispute register are three different documents. RadiusPoint will ask you for the first at kickoff. You should ask RadiusPoint, or any other provider, for the other two in writing before you sign.
Who files the dispute when an invoice is wrong?
The provider should file the dispute, age it, and confirm the credit on a later invoice, unless you have staffed that work internally on purpose. RadiusPoint files carrier disputes on the client’s behalf and tracks them in ExpenseLogic until the credit posts. A flag-only model hands you an exception list. A draft-only model writes the letter and leaves the follow-up with you. Ask which box you are buying.
A Fortune 100 manufacturer working with RadiusPoint recovered $450,000 in telecom refunds in year one, with $850,000 in ongoing annual savings and a $1.3 million year-one impact. That figure is a recovery story. It is only useful in a pre-sign meeting if the provider can say who filed, who chased, and how the credit was proven. Invoice auditing services find the error. Filing is the next job.
If the answer is “we send you a report,” write that into the statement of work as your labor, not as their managed service.
What percentage of invoice lines will you actually audit?
Ask for the invoice-line coverage percentage in writing, and ask RadiusPoint or any bidder what happens below a dollar threshold. RadiusPoint audits invoice line items against contracted rates and against inventory, rather than sampling, and records that work in ExpenseLogic. Loading an invoice is not auditing it. Anomaly flags are not a rate-table match.
Organizations implementing TEM typically see 15 to 30 percent cost reduction in year one. That range is a category-level observation, not a RadiusPoint guarantee, and it only holds if someone actually checks the lines. A glass manufacturer working with RadiusPoint saved $100,000-plus in year one. A healthcare provider reduced telecom expenses 26%. Ask each bidder to show a comparable finding, then ask whether those dollars were identified, disputed, or credited.
Telecom expense management pricing explains how providers charge. This question is about what you receive for that charge.
How will we get our inventory of record if we leave?
You should receive a documented export of services, BANs, locations, rates, disputes, and credits that the next operator can load. RadiusPoint treats the inventory of record as a client-owned file inside ExpenseLogic, not as a vendor hostage. Ask for the export format, the field list, and the number of business days after notice.
A food service client had 600-plus phones billed monthly with no employee identification, and 56 identified users who were no longer employed. That inventory work is published on the RadiusPoint managed mobility case study. If you cannot leave with that file, you will rebuild it from carrier bills. That rebuild is the cost people forget to price into the contract.
Inventory management at RadiusPoint has also recovered $174,000 in re-credits when the record of services did not match the bill. Ask the bidder how that kind of mismatch is found, and whether you keep the evidence pack.
The Sign-Day Seven
The Sign-Day Seven is RadiusPoint’s list of seven questions that have to be answered in the statement of work before a TEM signature is safe. ExpenseLogic is built so those answers can be tested after go-live. Buyer guides in this category list features. They do not lock a seven-question contract script that separates demo language from operating language.
| # | Question | Weak answer | Strong answer |
|---|---|---|---|
| 1 | Who files the dispute, and who chases the credit until it posts? | “We flag exceptions.” | Named team files, ages, and confirms the credit |
| 2 | What share of invoice lines is audited, not just loaded? | “We run analytics.” | A written coverage percentage against a rate table |
| 3 | How is the inventory built, and how is it exported if we leave? | “You can see it in the portal.” | Documented export, field list, and delivery days |
| 4 | What does the letter of agency authorize, and how is it revoked? | “Standard LOA.” | Scoped rights, logging, and a revoke path |
| 5 | Which pricing model are we buying, and what does it reward? | “Flexible commercial terms.” | Recovery share, per-invoice, per-line, or hybrid, with the incentive named |
| 6 | Who is the named analyst after go-live? | “A dedicated team.” | A named person plus a backup |
| 7 | What files do we receive on the last day? | “We’ll work with you.” | Inventory, dispute register, credit log, contract images |
Which pricing model are you buying, and what does it reward?
You are buying a recovery share, a per-invoice or per-line fee, a platform license, or a hybrid, and each model pays a different behavior. RadiusPoint is a managed service on ExpenseLogic, not a one-time contingency audit. A recovery-only fee pays someone to find refunds. It does not, by itself, pay them to stop the next invoice from repeating the error. Read that incentive before you read the case study.
This section only asks you to match the model to the work you just scoped. If you want disputes filed and inventory kept current, a license that leaves those tasks with you is the wrong purchase.
HumanGood, a named RadiusPoint client, has a published 315% ROI case. Use named cases as proof that a program can pay. Use the Sign-Day Seven to test whether this contract will produce that kind of program.
How RadiusPoint answers these questions in a managed TEM engagement
RadiusPoint delivers managed telecom expense management on ExpenseLogic: analysts audit lines, file disputes, and keep inventory, while you keep budget approval. The telecom expense management service is the commercial page for that model. This article is the question list you should still ask RadiusPoint, in writing, before you sign.
RadiusPoint has been in this work since January 1992. ISO 9001 certification has been in place since September 2002. Amalgam Insights named RadiusPoint a Distinguished Vendor on the 2024 TEM Vendor SmartList. The Capterra listing sat at 4.8 from 31 reviews through December 2025. Credentials tell you the firm is real. The Sign-Day Seven tells you the contract is real.
Sharon Watkins founded RadiusPoint after internal-audit work at a bank. The pre-sign problem is an audit problem with a sales deck attached. ExpenseLogic is the working paper after you sign. The seven questions are the working paper before you sign.
FAQ
Is this the same as a TEM RFP scorecard?
A scorecard ranks vendors. The Sign-Day Seven writes operating duties into one contract. RadiusPoint can sit on a scorecard and still fail this list if the statement of work is vague. Ask both.
Should we ask for a sample audit before we sign?
Yes, if you can provide a slice of invoices and contracts. RadiusPoint will treat a sample as evidence, not as a promise of year-one dollars. A sample that only loads PDFs and never files a dispute is a warning.
What if the provider will not name an analyst?
Write a named analyst plus a backup into the statement of work, or treat the gap as a staffing risk. RadiusPoint’s model is a named human on the account. A ticket queue with no name is a different purchase.
Do we still need a letter of agency if we only want reporting?
If the provider must pull invoices or talk to a carrier, yes. Scope it. A read-only billing grant is not the same as ordering rights. RadiusPoint will tell you which grant it is asking for.
What to do before you sign
Print the Sign-Day Seven. Put the bidder’s answers in the left column and the contract clause in the right. If a cell is empty, you are buying a demo. RadiusPoint will fill those cells for a managed ExpenseLogic engagement. Every week you sign without them is a week you cannot test the work.
References
- How to Choose a Telecom Expense Management Company | RadiusPoint
- What Is Telecom Expense Management? | RadiusPoint
- Telecom Expense Management Services | RadiusPoint
- Telecom Expense Management Pricing | RadiusPoint
- Invoice Auditing Services | RadiusPoint
- Vendor Evaluation | RadiusPoint
- How Managed Mobility Services Cut Costs 22% ($400K in Year 1) | RadiusPoint
- HumanGood Achieved 315% ROI with RadiusPoint | RadiusPoint
- RadiusPoint Recognized as a Distinguished Vendor in the 2024 Amalgam Insights Vendor SmartList | RadiusPoint
- ExpenseLogic reviews | Capterra
- Sharon R. Watkins | RadiusPoint
Related articles
- Telecom Expense Management Companies
- Telecom Expense Management Pricing
- Invoice Auditing Services
- Telecom Expense Management Services
Disclaimer
This article is general information for finance, IT, and procurement teams evaluating a TEM contract. It is not legal advice. Outcomes cited are from specific RadiusPoint client engagements already in RadiusPoint’s published case studies and are not a guarantee of future results. Category-level ranges are hedged and are not RadiusPoint promises.
Utility Rate Reclassification and How It Lowers Bills
By Sharon Watkins, Founder and CEO, RadiusPoint · 28 August 2026 · 12 min read
Utility rate reclassification is the filed request that moves a meter onto a different published rate class so the same kilowatt-hours and peak kilowatts are priced under a schedule the load actually qualifies for. A plant that added a night shift two years ago can still be billed as a daytime general-service account. Rate reclassification is a Utility Expense Management (UEM, not Unified Endpoint Management) tariff action. RadiusPoint runs it on ExpenseLogic as a schedule change, not as a vacant-cost recovery and not as a line-item bill audit.
The live utility rate optimization page covers the wider program, including demand management and power-factor work.
Key Takeaways
- Utility rate reclassification changes the published class on an account. It does not change the meter read, the tenant name, or the occupancy date.
- The U.S. commercial average was 14.19 cents per kWh in June 2026, up 4.8% from June 2025, per the EIA Electricity Monthly Update.
- RadiusPoint published vacant cost recovery that decreased utility expenses by 12%, and a multi-location client paid $1,500 a month ($18,000 a year) for utilities at closed locations. Those are payer problems. Reclassification is a schedule problem.
- An elevator-company engagement cut monthly waste expenditure 28% through vendor and contract work. RadiusPoint keeps that credit type separate from a rate-class move.
- The Rate-Class Fit Test uses four gates: load factor, voltage or service level, demand threshold, and operating hours.
The Short Version
If the invoice math is correct and the account is still on a class the load no longer fits, RadiusPoint should file a rate reclassification in ExpenseLogic, not open a billing-error dispute.
In this article
- What utility rate reclassification actually changes
- How is rate reclassification different from a utility bill audit?
- Why a correctly calculated bill can still be the wrong bill
- What load data do you need before you apply for a new rate class?
- The Rate-Class Fit Test
- Who files a rate reclassification, and who has to approve it?
- How RadiusPoint and ExpenseLogic keep tariff analysis in the monthly cycle
What utility rate reclassification actually changes
Utility rate reclassification changes the published tariff class the utility uses to price an account, while consumption and peak demand stay on the same meter. RadiusPoint treats that class change as a Utility Expense Management (UEM) action inside ExpenseLogic. The invoice still lists energy charges, demand charges, customer charges, and riders. The class decides which published prices attach to those lines.
A reclassification is a customer-initiated filing in most territories. The utility will keep billing the class it assigned at turn-on until someone applies, qualifies, and is moved. RadiusPoint stores the current schedule, the interval history, and the candidate class in ExpenseLogic so finance can see the before-and-after on the same account.
Vacant cost recovery asks who should be the customer of record. Rate reclassification asks which published class that customer should sit in. RadiusPoint keeps both on the utility expense management service so a facilities lead can open two exception types without mixing the workstreams.
How is rate reclassification different from a utility bill audit?
A utility bill audit at RadiusPoint tests whether this invoice matches the meter, the tariff, and the signed contract. Rate reclassification tests whether that tariff is still the class the site qualifies for. RadiusPoint runs both inside ExpenseLogic and posts them as different exception types. A bill audit recovers a wrong multiplier, a duplicated demand line, or a tax that does not belong. A reclassification leaves those lines intact and changes the schedule they are priced on.
Invoice auditing services catch category errors on telecom and related invoices. On the utility side, the same discipline still stops at “is this charge correct for the class we are on.” Reclassification starts after that question is answered yes.
Vacant cost recovery is a third job. RadiusPoint’s vacant cost recovery work is the owner-name and occupancy match. Do not send a rate-class application to fix a tenant who never transferred service.
Why a correctly calculated bill can still be the wrong bill
A correctly calculated bill can still be the wrong bill when the published class no longer matches how the site draws power. RadiusPoint sees this in ExpenseLogic after a shift change, an automation project, a square-footage change, or a voltage upgrade. The utility did the arithmetic. The class was assigned years earlier. Finance kept paying because the due date was real.
The U.S. commercial average sat at 14.19 cents per kWh in June 2026, 4.8% above June 2025, according to the EIA Electricity Monthly Update (U.S. retail sector, June 2026). At that all-in level, a class that prices the same kilowatt-hour and the same peak kilowatt on a different published schedule changes the invoice without touching the meter. RadiusPoint does not publish a house percentage for reclassification savings. The dollar outcome is the difference between two filed tariffs on one load.
RadiusPoint has published other utility outcomes that are easy to confuse with a class change. Vacant cost recovery decreased utility expenses by 12%. A multi-location client paid $1,500 a month, $18,000 a year, for utilities at closed locations. An elevator-company engagement cut monthly waste expenditure 28%. Those credits stay in their own buckets in ExpenseLogic.
What load data do you need before you apply for a new rate class?
You need interval history, the current tariff sheet, billed demand, and a dated note on how the site now operates, before anyone files. RadiusPoint loads those four inputs into ExpenseLogic so the Rate-Class Fit Test has evidence. Twelve to 24 months of interval data is the usual ask from utilities and from analysts, because one summer peak can hide a winter load factor. The current tariff sheet tells you which classes exist and what kW floor, voltage, or hours each one requires.
A class application without operating-hours context fails in two directions. You can apply for a time-of-use class a 9-to-5 office cannot use. You can also stay on a high-demand general-service class after production moved off-peak. RadiusPoint will not file from a single monthly kWh total. ExpenseLogic needs the peak interval and the hours that created it.
Site status still matters. A closed location is a vacant-cost or disconnect job first. RadiusPoint will not reclassify a dark meter to “save” an account that should be ended.
The Rate-Class Fit Test
The Rate-Class Fit Test is RadiusPoint’s four-gate method for load factor, service voltage, demand threshold, and operating hours on one account. ExpenseLogic is where RadiusPoint stores the four inputs so the test can run when a site changes, not only when a consultant is hired. Ranking tariff pages in 2026 walk demand charges. They do not teach this four-gate sequence as a named finance test.
| Gate | What RadiusPoint loads into ExpenseLogic | Pass condition |
|---|---|---|
| Load factor | Interval kWh versus billed kW | The class matches a steady or peaky profile |
| Voltage / service | Account service level on the tariff | Secondary, primary, or transmission eligibility is met |
| Demand threshold | Peak kW against the class floor | The site is over or under the published kW gate |
| Operating hours | Shift calendar and known process loads | Time-of-use or interruptible classes are usable |
A fail on gate 4 with a pass on gate 3 is a time-of-use candidate. A fail on gate 2 is a service-level application, which can require utility construction, not only a paper filing. RadiusPoint writes the fail type onto the ExpenseLogic exception so facilities is not guessing. Vacant cost is the wrong payer. Bill audit is the wrong charge. Rate class is the wrong schedule. RadiusPoint will not treat those three as one “utility savings” line.
Who files a rate reclassification, and who has to approve it?
The customer of record files, and the utility (or the commission rules behind that utility) approves if the account qualifies. RadiusPoint prepares the analysis in ExpenseLogic and can submit on the client’s authority where a letter of agency or similar grant allows it. The utility is not obligated to shop you into a cheaper class. That is why a paid invoice can stay expensive for years.
Approval is a qualification test, not a negotiation. If the site is below a demand floor, the industrial class is closed. If the site cannot shed load, an interruptible rider is closed. RadiusPoint will show the failed gate rather than promise a move. Utility service options on the RadiusPoint site is the procurement companion for deregulated supply. Reclassification of the delivery class is a different filing.
Sharon Watkins founded RadiusPoint in January 1992. The class-change problem is an audit problem with a tariff book attached. ExpenseLogic is the working paper. RadiusPoint is the team that files.
How RadiusPoint and ExpenseLogic keep tariff analysis in the monthly cycle
RadiusPoint runs tariff analysis as managed Utility Expense Management, and ExpenseLogic watches for a load that has left its class. The utility expense management service already stores tariff schedules, demand readings, and site comparisons. Reclassification is the exception that says “apply,” not “dispute.”
A one-time consulting study goes stale when the next shift change lands. RadiusPoint keeps the Rate-Class Fit Test on the same monthly feed that catches a vacant name and a closed-site bill. ISO 9001 certification, in place at RadiusPoint since September 2002, is how that exception process stays repeatable when the location count moves. RadiusPoint published a client that grew from 170 to 1,200 locations. At that scale, a missed class on a handful of sites is not a rounding error.
RadiusPoint’s Capterra listing sat at 4.8 from 31 reviews through December 2025. Amalgam Insights named RadiusPoint a Distinguished Vendor on the 2024 TEM Vendor SmartList. Those credentials sit on the firm. They are not a savings percentage for a class change.
FAQ
Does rate reclassification work on gas, water, and waste, or only on electric?
Electric is where published commercial classes and demand gates show up most often. RadiusPoint still reviews gas, water, sewer, and waste schedules in ExpenseLogic when a territory publishes more than one class. The elevator-company 28% waste reduction was contract and vendor work, which RadiusPoint keeps separate from a class filing.
Can you recover prior months after the class is changed?
Only if the utility’s tariff or the commission rules allow a back-effective date, and only with interval evidence RadiusPoint can attach in ExpenseLogic. The operational job is to show the qualification date. Counsel and the utility decide whether that date is retroactive. RadiusPoint does not write tariff language.
Is a time-of-use enrollment the same as a rate reclassification?
Time-of-use is one kind of class or rider change. It still has to pass the operating-hours gate. RadiusPoint will not enroll a site that cannot move load off-peak and then call the higher on-peak rate a win.
How is this different from shopping a retail energy supplier?
Shopping a supplier changes the energy commodity in a deregulated market. Reclassification changes the utility’s published delivery or bundled class. RadiusPoint can support both. They are different filings and different lines on the invoice.
Do you need interval meters to do this?
You need enough history to prove load factor and peak timing. Interval data is the clean path. A monthly kWh and kW pair is a start, not a filing pack. RadiusPoint will say so in ExpenseLogic rather than file blind.
What to do before the next utility cycle
If you cannot name the published class on last month’s five largest electric accounts, start there. RadiusPoint will load those invoices into ExpenseLogic and run the Rate-Class Fit Test with you. Every cycle you skip is another month priced on a class the load may have already left.
References
- Electricity Monthly Update, End Use: June 2026 | U.S. Energy Information Administration
- ExpenseLogic | RadiusPoint
- Utility Expense Management | RadiusPoint
- Vacant Expense Recovery Solution | RadiusPoint
- Utility Rate Optimization | RadiusPoint
- Invoice Auditing Services: What They Cover and How to Choose a Provider | RadiusPoint
- Utility Service Options | RadiusPoint
- Sharon R. Watkins | RadiusPoint
- RadiusPoint Recognized as a Distinguished Vendor in the 2024 Amalgam Insights Vendor SmartList | RadiusPoint
- ExpenseLogic reviews | Capterra
Related articles
Disclaimer
This article is general information for finance and facilities teams. It is not legal advice on tariffs, commission rules, or back-effective dates. Outcomes cited are from specific RadiusPoint client engagements already in RadiusPoint’s published case studies, or from named public sources, and are not a guarantee of future results.
How Companies Recover Telecom Refunds and Credits From Carriers
By Sharon Watkins, Founder and CEO, RadiusPoint · 27 August 2026
Companies recover telecom refunds by filing a documented dispute, keeping a carrier case number open, and confirming the credit posted on a later invoice. A finding in a spreadsheet is not a refund. It is a claim that dies if nobody pursues it through the carrier’s window.
Refund recovery is the work that turns an audit exception into cash on a bill you can show finance. RadiusPoint’s live FAQ says credits pending are tracked in ExpenseLogic until the credit is received. That sentence is the job.
Key Takeaways
- Filed is not recovered. Recovery is the posted credit, allocated in the next GL file.
- A Fortune 100 manufacturer on RadiusPoint’s published record recovered $450,000 in telecom refunds in year one.
- Inventory management on that same published record recovered $174,000 in re-credits.
- Unneeded toll-free numbers produced $18,000 a year. Contract rate optimisation produced $120,000 a year.
- 47 CFR 64.2401 requires a toll-free dispute contact on the bill and forbids unauthorized charges (Cornell LII).
The Short Version
Keep a register: case number, service ID, months open, dollars claimed, window, status. Close a row only when the credit hits an invoice.
| Stage | Evidence | Failure mode |
|---|---|---|
| Find | Exception vs rate or inventory | Slide deck, no claim |
| File | Carrier case number | Email with no ticket |
| Pursue | Escalation log | Finder leaves, case dies |
| Post | Credit on a billed invoice | “Agreed” but never appears |
| Allocate | GL / cost centre file | Cash lands in a dump account |
In This Article
- Finding an Error Is Not Recovering a Credit
- How does a carrier credit actually post?
- What do Truth-in-Billing rules actually give you?
- What belongs on the refund register?
- Which refund figures are published?
- How RadiusPoint Pursues the Case
- Frequently Asked Questions
Finding an Error Is Not Recovering a Credit
Finding an error is the audit, and recovering the credit is a second job with a case number and a posted invoice. Recovering the credit is a second job with a case number, a window, and a posted invoice.
ExpenseLogic’s expense-audit module lists dispute tracking next to line-item detail. The capability statement names credit recovery and prevention of recurring error through maintained reference data. Prevention matters because a recovered credit that repeats next month was a refund, not a fix.
Sharon Watkins’s published line is that the telecom industry “can’t keep up with the ubiquitous challenges and doesn’t have the time to identify savings.” Identification is cheap compared with pursuit. The people who find the error are rarely the people the carrier will still take a call from six months later.
A glass manufacturer on the published record saved more than $100,000 in year one at 200% ROI. The number is useful here only if you ask whether those dollars were credits received or costs avoided. RadiusPoint’s live capability language groups “telecom refunds and cost savings” together on a $1.3 million program.
How does a carrier credit actually post?
A carrier credit posts as a later invoice line, bill adjustment, or remittance you can show finance once the carrier issues it. RadiusPoint tracks the pending credit inside ExpenseLogic until that moment.
Typical post paths:
- Credit memo on the next BAN invoice.
- Adjustment inside a tax or surcharge bucket, easy to miss.
- Check or wire, rare on large estates.
- “Account credit” that sits until someone asks AP to apply it.
If the credit is buried in a tax bucket, allocation has to follow it or the department that overpaid never sees the cash. That is why the last step of Credit-to-Cash is the GL file, not the carrier email.
Managed mobility services recover a different flavour of credit: zero-use and ex-employee lines that should stop billing. A food service client cut 22% ($400,000) in year one across more than 600 lines. Some of that is avoidance going forward. Ask which dollars were back-credits.
Two-day invoice processing, a live FAQ claim, helps you see the credit when it lands. It does not file the dispute.
What do Truth-in-Billing rules actually give you?
Truth-in-Billing rules give you a dispute contact and a clear bill, not a deposited refund you still must pursue. RadiusPoint’s job is to file inside the window and keep the case alive.
47 CFR 64.2401 requires a clear description of each charge, a named provider, a distinct section for third-party charges, a toll-free inquiry number, and a ban on unauthorized charges (e-CFR via Cornell). The FCC’s Truth-in-Billing page restates those duties and was updated 22 April 2025 (FCC).
Those rules give you a contact and a right to contest. They do not deposit the money. Cramming (unauthorized third-party charges) is the consumer-facing cousin of a problem enterprises still see on BAN invoices. Recovery is still a case file.
Gartner forecast $1.354 trillion in communications services spend for 2026 (Gartner, 27 July 2026). A small error rate on a number that large is why pursuit, not discovery, is the scarce skill.
What belongs on the refund register?
Finance should demand a six-field refund register: case number, service ID, months open, dollars claimed, window, and posted status. RadiusPoint’s pending-credit tracking is that register inside ExpenseLogic.
A register without a case number is a wish list. A register that closes on “carrier agreed” is a wish list with a date. Close only on a posted invoice image.
Unapplied credits are a named finding type in RadiusPoint’s audit language: a credit agreed but never posted. Inventory of record plus the register is how you stop paying for the same error after you “won.”
Utility expense management (UEM means Utility Expense Management, not Unified Endpoint Management) produces the same register for meters. Do not mix those rows into a telecom BAN without a service-ID key.
Which refund figures are published?
RadiusPoint’s usable refund proof is the published library of published named client outcomes, and never a guarantee of future cash.
published figures that name refund, re-credit, or a cash-like recovery:
- Fortune 100 manufacturer: $450,000 telecom refunds, year one.
- Inventory management: $174,000 in re-credits.
- Unneeded toll-free numbers: $18,000 a year.
- Contract rate optimisation: $120,000 a year.
- $250,000-plus in unrealised cost savings uncovered (published language; treat as uncovered value, not as posted cash, unless the case file says posted).
Industry range, hedged: organisations implementing TEM typically see 15% to 30% cost reduction in year one. That is category language, not a RadiusPoint refund promise. Average ROI of 370% to 580% is an industry-range statement and is an average of self-published figures. Prefer a named case.
Has managed more than $550 million in annual client spend is an industry-range statement and from 2019. Skip it when you are proving a refund.
Capterra 4.8 from 31 reviews through December 2025 (Capterra), ISO 9001 since 2002, and Amalgam Insights Distinguished Vendor 2024 are process credentials. They support the claim that someone will still be on the case next quarter.
How RadiusPoint Pursues the Case
RadiusPoint analysts file with the carrier under a scoped letter of agency, then keep the case in ExpenseLogic until the credit posts. Telecom expense management is the service wrapper. Sharon Watkins is the founder who still treats pending credits as unfinished work.
The about RadiusPoint page is the company story. The operating rule is here: a dedicated internal audit team reports daily statistics on invoice processing and support-ticket accuracy, per the live capability statement. Daily is the cadence a register needs.
An automotive salvage client published $1.3 million on the TEM page. The capability page also cites a $1.3 million telecom refunds-and-savings program. Use the figure as published scale. Ask, in diligence, how much of it was posted credits versus avoided spend.
Ask to see five closed rows: case number, invoice image of the credit, and the GL line. If a provider can find errors but cannot show those three, you have an audit. You do not have recovery.
Frequently Asked Questions
If the auditor found $200,000, do we have $200,000?
No. You have a claim. You have the money when the credit posts and the GL file reflects it. Ask for the register, not the slide.
What is the difference between a refund and cost avoidance?
A refund or re-credit is cash or a billed credit for a past error. Avoidance is the same error not repeating. Both matter. Only the first belongs on a refund page.
Do Truth-in-Billing rules force the carrier to pay?
They force a clear bill, a dispute contact, and no unauthorized charges. They do not set your enterprise window or wire the money. You still file and pursue.
Can we recover credits on wireless lines?
Yes, when the line should not have billed (zero-use, ex-employee, wrong plan). RadiusPoint’s MMS work is the usual path. The register fields do not change.
Close the Row When the Invoice Shows the Credit
A dispute without a posted invoice is still open, and the register should keep that row live until the credit image exists. Build the register. Staff the pursuit. Allocate the cash.
Request a demo of ExpenseLogic and ask to walk five pending credits to posted. Every month a case sits without a number is another month the carrier keeps the money.
References
- 47 CFR § 64.2401: Truth-in-Billing Requirements | Cornell LII / e-CFR
- Truth-In-Billing Policy | Federal Communications Commission, updated 22 April 2025
- Gartner Forecasts Worldwide IT Spending to Grow 14.2% in 2026, Totaling $6.37 Trillion | Gartner newsroom
- ExpenseLogic | Capterra
- Telecom Expense Management | RadiusPoint
- ExpenseLogic | RadiusPoint
- Managed Mobility Services | RadiusPoint
- About | RadiusPoint
- RadiusPoint Capability Statement | RadiusPoint
- Sharon Watkins | RadiusPoint
Related Reading
This article is educational. RadiusPoint does not guarantee refund amounts, credit posting dates, or carrier outcomes. Figures were current as of 28 August 2026.
How Long a Telecom Expense Management Rollout Actually Takes
By Sharon Watkins, Founder and CEO, RadiusPoint · 26 August 2026
A telecom expense management rollout takes as long as it takes to build a defensible inventory, collect letters of agency, gather scattered invoices, and agree the ERP file spec. RadiusPoint does not publish a week count, and any provider who gives you one before seeing those four inputs is selling a Gantt, not a close date.
TEM implementation time is gated by inventory completeness, not by software provisioning. You bought the program because invoices were already late and incomplete. That mess is the clock.
Key Takeaways
- RadiusPoint’s published proof is stated in year-one outcomes, not in a published week range.
- Organisations implementing TEM typically see 15% to 30% cost reduction in year one. That is an industry-range statement, not a RadiusPoint guarantee.
- A Fortune 100 manufacturer on RadiusPoint’s published record recovered $450,000 in telecom refunds in year one, plus $850,000 in ongoing annual savings.
- A food service client cut 22% ($400,000) in year one across more than 600 lines.
- Two-day invoice processing is a live RadiusPoint operating claim after a bill exists. It is not a rollout clock.
The Short Version
Do not accept a week count as the answer. Ask which work unit is open: agency letters, invoice scatter, inventory build, or the ERP spec. Published RadiusPoint proof lands in year one.
| Work unit | Why it sets the clock | What “done” looks like |
|---|---|---|
| Letters of agency | Carriers will not release records without them | Signed, scoped LOAs with each carrier |
| Invoice scatter | AP, IT, and sites hold different years | Agreed BAN list and a first complete cycle |
| Inventory build | No audit or allocation without it | Service IDs reconciled to CSRs |
| ERP file spec | Close cannot use a dashboard | Accrual and GL formats accepted by AP |
| First validated cycle | Software live is not operational live | One month of exceptions worked to a register |
In This Article
- Why RadiusPoint Will Not Quote a Week Count
- What actually consumes the calendar?
- Why is year one the honest published window?
- What must you bring before day one?
- What Live Means, and What It Does Not
- Frequently Asked Questions
Why RadiusPoint Will Not Quote a Week Count
RadiusPoint will not quote a TEM week count because none of RadiusPoint’s published case studies states one. Sharon Watkins has run this company since January 1992. The honest answer after three decades is that the inventory is the clock.
Vendor blogs publish 90 to 120 days, 90 to 180 days, or 4 to 8 weeks. Those are their marketing ranges, not RadiusPoint’s, and they are not adopted here. The capability statement says setup is completed by the RadiusPoint team and that configuration follows the client. It does not attach a week number to that sentence.
ISO 9001 since September 2002 and a 2024 Amalgam Insights Distinguished Vendor listing are process signals. They are not a Gantt. Capterra lists ExpenseLogic at 4.8 from 31 reviews through December 2025 (Capterra). Reviews describe the work.
Gartner named RadiusPoint a Representative Vendor in the 2023 Market Guide for TEM Services. Always keep the year. That recognition is not a delivery calendar.
What actually consumes the calendar?
Four client-side inputs consume the calendar: letters of agency, invoice scatter, inventory quality, and ERP specs RadiusPoint cannot skip. RadiusPoint’s telecom expense management service cannot audit a circuit the carrier has not confirmed.
Here they matter as a gate: no LOA, no customer service records, no inventory of record. Invoice scatter is the second gate. Twelve to thirty-six months of bills usually sit in AP, IT, and site inboxes. That gathering is not software.
Inventory build is the longest honest work. ExpenseLogic can store the result. It cannot invent a CSR the carrier has not sent. The ERP spec is the fourth gate: accrual files and GL coding have to match the client’s close, which is why RadiusPoint collects file specifications during setup.
A glass manufacturer on the published record saved more than $100,000 in year one at 200% ROI. That number is a year-one outcome. It is not evidence the project finished in a quoted week.
Why is year one the honest published window?
Year one is the only time window RadiusPoint’s published proof consistently uses for outcomes rather than a week count. If a proposal talks in weeks and the proof talks in years, believe the proof.
Published year-one marks:
- Fortune 100 manufacturer: $450,000 telecom refunds, $850,000 ongoing annual savings, $1.3 million total year-one impact, more than 10,000 wireless devices.
- Food service: 22% reduction, $400,000, more than 600 lines.
- Global glass manufacturer: more than $100,000, 200% ROI.
- Healthcare provider: 26% reduction in telecom expenses (period stated as the engagement result, not as a week count).
Industry range, hedged: organisations implementing TEM typically see 15% to 30% cost reduction in year one. Attribute that to the TEM category, not to a RadiusPoint promise.
Has managed more than $550 million in annual client spend is an industry-range statement and dates to 2019. Use it as historical scale only. Client growth from 170 to 1,200 locations is published scalability proof, which tells you the platform can absorb a larger estate. It still does not give you a week count.
What must you bring before day one?
You must bring carrier and BAN lists, signed letters of agency, trusted inventory, and the ERP layout AP will accept. RadiusPoint’s managed mobility services add employee IDs and device serials to that pack.
This section only names the items that move the clock. If any of them are missing, the honest range stays “year one to first validated outcomes,” not a week you picked because a competitor printed one.
About RadiusPoint states the firm has been serving businesses since 1992. Longevity is relevant because carrier processes have not gotten faster. The telecom industry, in Sharon Watkins’s published line, “can’t keep up with the ubiquitous challenges and doesn’t have the time to identify savings.” That is why the rollout is a records project.
Utility expense management (UEM means Utility Expense Management, not Unified Endpoint Management) adds meter lists and tariffs to the same pack when utilities are in scope. Do not pretend a TEM-only Gantt covers meters.
What Live Means, and What It Does Not
Live means one complete invoice cycle has been received, validated, exceptioned, and exported into AP, not merely a portal login. RadiusPoint’s two-day processing claim starts after that cycle exists. A portal login is not live.
Dispute credits still in flight are not a reason to call the rollout unfinished, and they are not a reason to call it finished. They are a register. Healthcare 448% ROI and HumanGood 315% ROI are published outcomes of running the process, not of flipping a switch.
Ask every provider a single question: what work is complete on the day they say they are live? If the answer is “the software is provisioned,” you still do not have TEM. If the answer is “the inventory of record and the first coded file,” you are in the honest window.
Frequently Asked Questions
How long does a TEM implementation take at RadiusPoint?
RadiusPoint does not publish a week count. Time follows letters of agency, invoice scatter, inventory build, and the ERP file spec. Published proof is year-one outcomes.
Why do other vendors quote 90 days or 8 weeks?
Those are their marketing ranges. They are not in RadiusPoint’s published case studies, so they are not repeated here as a promise or as our range.
Is two-day invoice processing the rollout time?
No. Two-day processing is how fast a received invoice is worked after go-live. It is not how long it takes to build the inventory that invoice is tested against.
When should we expect savings?
Published RadiusPoint cases that state a period use year one. Category-level industry language is 15% to 30% in year one for organisations that implement TEM. Neither is a guarantee.
What is the fastest way to stall a rollout?
Leave letters of agency unsigned, or keep invoices in site inboxes. Software cannot request a CSR the carrier has not been authorised to send.
Ask for Work Units, Not a Gantt
If a proposal’s first number is a week count and its proof is year-one, the week count is decoration. Score the four gates. Then look at year-one cases.
Request a demo of ExpenseLogic and ask what RadiusPoint considers live. Every month spent arguing about a fictional week is a month the same inventory errors keep billing.
References
- ExpenseLogic | Capterra
- Gartner Forecasts Worldwide IT Spending to Grow 14.2% in 2026, Totaling $6.37 Trillion | Gartner newsroom (market context only)
- Telecom Expense Management | RadiusPoint
- ExpenseLogic | RadiusPoint
- Managed Mobility Services | RadiusPoint
- About | RadiusPoint
- RadiusPoint Capability Statement | RadiusPoint
- Sharon Watkins | RadiusPoint
Related Reading
This article is educational. RadiusPoint does not guarantee a rollout date, a week count, or a savings percentage. Figures were current as of 28 August 2026.
What a Telecom Accrual File Is, and How Finance Teams Build One
By Sharon Watkins, Founder and CEO, RadiusPoint · 24 August 2026
A telecom accrual file is a structured estimate of circuits, lines, and meters that were consumed this period but not yet invoiced, coded so the close can post. If you cannot name the unbilled service IDs at month-end, you are not accruing telecom. You are hoping last month repeats.
A telecom accrual file is the finance extract of live inventory that still lacks an invoice, not a copy of the AP pay file. RadiusPoint’s live TEM FAQ says the company can provide a monthly accrual file based on the client’s accounting specifications, delivered on the client’s timing.
Key Takeaways
- Accrued expenses are costs incurred with no invoice in hand by close. Accounts payable starts when the invoice arrives (FinQuery, 29 May 2026).
- RadiusPoint works a missing-bill report daily and can deliver a monthly accrual file specified during setup (live TEM FAQ).
- ExpenseLogic lists accrual files next to allocation in the accounts payable module.
- RadiusPoint processes invoices within a two-day window after receipt, a live FAQ operating claim, which shrinks late-fee risk once the bill exists.
- Gartner forecast $1.354 trillion in worldwide communications services spend for 2026 (Gartner, 27 July 2026).
The Short Version
Build the file from inventory and rates, not from last month’s paid total. Reverse it when the invoice lands so you do not expense the same circuit twice.
| Artifact | Trigger | Posts to | Certainty |
|---|---|---|---|
| Accrual file | Service consumed, invoice missing | Accrued expense | Estimate |
| Invoice / AP file | Invoice received | Accounts payable | Billed amount |
| Allocation file | Either of the above, split | Cost centres / GL | Rule-based |
In This Article
- The Accrual File, Defined
- How do finance teams calculate the rows?
- Why is a missing bill an accrual row?
- Why is last month’s total a weak accrual?
- What RadiusPoint Delivers at Close
- Frequently Asked Questions
The Accrual File, Defined
A telecom accrual file is a row-level list of unbilled service IDs with amount, period, GL, and reversal flag. RadiusPoint treats it as an AP-module output, sitting beside allocation, not as a slide in a QBR.
FinQuery’s May 2026 explainer is the accounting backbone: accrued expenses exist because the benefit was consumed and the invoice was not. Utilities and usage-based services are named in that category. Telecom circuits and wireless lines behave the same way. The file is how a TEM program makes that journal auditable.
The capability statement lists accounts payable feeds, accrual files, and general ledger coding in the client’s own chart of accounts. That sentence is the product definition. This page teaches the contents.
Do not confuse the file with RadiusPoint’s older misspelled accrual-accounting primer. That post explains the principle. This page explains the artifact finance actually loads.
How do finance teams calculate the rows?
Finance calculates each accrual row from a live inventory record, a rate, and the number of unbilled days in the period. RadiusPoint’s telecom expense management stack already holds the inventory, the contract rate, and the invoice history, which is why the file can be more than a guess.
Three honest methods, in descending quality:
- Contract or tariff rate times the open days for that service ID.
- Last billed amount for the same service ID, adjusted for known MACDs.
- Account-level average, used only when the inventory row is still being built.
Method 3 is a placeholder. It is how most closes work today, and it is why a late $80,000 circuit makes the next month look like a miracle. Healthcare AP and ordering automation on RadiusPoint’s published record showed a 448% ROI. HumanGood, a named client, showed 315% ROI. Those figures are published process outcomes. They are not a promise that your accrual variance disappears.
Reverse the row when the invoice posts. FinQuery is blunt: accruals that are not reversed double-count. ExpenseLogic’s job is to know which invoice killed which accrual row.
Why is a missing bill an accrual row?
A missing bill on a live service is an accrual row because the inventory says you consumed it this period. RadiusPoint works the missing-bill report daily, tracks vendor conversations, and sets reminders if the invoice is still out, which is the live FAQ language.
Utility expense management (UEM means Utility Expense Management here, not Unified Endpoint Management) produces the same artifact for meters. Electric, gas, water, sewer, and waste invoices arrive on their own calendars. A retail chain that closes on day six cannot wait for every utility.
Client growth from 170 to 1,200 locations is published RadiusPoint scalability proof. At 1,200 sites the missing-bill report is the close. Daily missing-bill work is also how RadiusPoint says it avoids disconnects and late fees, which is a service-continuity claim, not an accrual formula.
Two-day invoice processing after receipt is a live operating claim. It does not replace the accrual. It shortens the gap between “invoice exists” and “AP can post,” so the reversal happens inside the next cycle instead of the next quarter.
Why is last month’s total a weak accrual?
Last month’s paid total ignores new circuits, dead circuits, late credits, and every BAN that did not bill on time. RadiusPoint still sees organisations close on that number because it is available.
Gartner’s July 2026 communications services line is $1.354 trillion, growing 4.4% (Gartner newsroom). A category that large, moving 4.4%, will not land every invoice before your close calendar. The file exists because the market is late, not because finance is fussy.
Capterra lists ExpenseLogic at 4.8 from 31 reviews through December 2025 (Capterra). ISO 9001 has been in place since September 2002. Amalgam Insights named RadiusPoint a Distinguished Vendor in 2024. Those are process credentials for a file an auditor will sample.
Organisations implementing TEM typically see 15% to 30% cost reduction in year one. That range is an industry-range statement, not a RadiusPoint guarantee. Write it that way. Do not put it in the accrual file as a plug.
What RadiusPoint Delivers at Close
RadiusPoint delivers the monthly accrual file on the specification collected during setup, then keeps delivering it on the client’s close calendar. Sharon Watkins has been adjacent to this problem since 1992: invoices that arrive after the period they describe.
The about RadiusPoint page is the company narrative. The operating pieces are here: inventory of record, daily missing-bill report, two-day process once the bill exists, coded GL and accrual extracts.
Has managed more than $550 million in annual client spend is an industry-range 2019-era statement. Use it only as historical scale, or wait for an updated figure. Prefer the named published cases when you need a number a prospect can check.
Ask to see last month’s accrual file and the reversals that cleared this month. If a provider cannot show both, they are sending you a spend report.
Frequently Asked Questions
Is the accrual file the same as the invoice upload?
No. The invoice upload is AP. The accrual file is the estimate for service IDs that have not been invoiced yet. RadiusPoint produces both, on the client’s file spec.
What if we just accrue a flat percentage of last year?
You will be close in a quiet month and wrong in a month with installs, disconnects, or a missing BAN. Inventory-based rows survive those months. Flat percentages do not.
Do utilities belong in a telecom accrual file?
They belong in the same close package, often as a second file or a second sheet, at meter grain. RadiusPoint’s UEM (Utility Expense Management) is the source of those rows.
When do you reverse the accrual?
When the matching invoice posts, or when you learn the service died. FinQuery’s control point is the same: reverse in the period the invoice is expected so the expense hits once.
Does two-day invoice processing replace the accrual?
No. Two-day processing starts after the invoice exists. The accrual covers the days before it exists. You need both.
Close on Inventory, Not on Hope
If the file cannot name the unbilled circuit, you do not have a telecom accrual, only a plug for the close. You have a plug.
Request a demo of ExpenseLogic and ask for the monthly accrual file layout plus the missing-bill report. Every close that skips those rows is another variance you will explain in the next meeting.
Latest Updates
- 24 August 2026: Drafted from live TEM FAQ (accrual file, missing-bill, two-day processing), FinQuery 29 May 2026, Gartner 27 July 2026, and published-proof proof rules.
References
- Accrued Expenses vs. Accounts Payable Explained | FinQuery, 29 May 2026
- Gartner Forecasts Worldwide IT Spending to Grow 14.2% in 2026, Totaling $6.37 Trillion | Gartner newsroom
- ExpenseLogic | Capterra
- ExpenseLogic | RadiusPoint
- Telecom Expense Management | RadiusPoint
- Utility Expense Management | RadiusPoint
- About | RadiusPoint
- RadiusPoint Capability Statement | RadiusPoint
- Sharon Watkins | RadiusPoint
Related Reading
This article is educational. RadiusPoint does not guarantee close accuracy or a specific accrual variance. Figures were current as of 28 August 2026 and should be re-checked on refresh.

How to Audit a Utility Bill for Errors
By Sharon Watkins, Founder and CEO, RadiusPoint · 22 August 2026
You audit a utility bill by testing each meter for the right multiplier, the right tariff, and billed consumption that matches interval or register data. A facilities manager who only compares this month’s account total to last month’s will miss a current-transformer ratio that has been wrong since the last meter swap.
A utility bill audit is a meter-level reconciliation of tariff, consumption, and inventory, not an account-level variance check. RadiusPoint’s utility expense management (UEM here means Utility Expense Management, not Unified Endpoint Management) is built on that grain. This page is not a telecom invoice audit and it is not vacant cost recovery.
Key Takeaways
- Audit three things on every meter: configuration (including the multiplier), tariff or rate class, and consumption or demand.
- EIA counted 140,491,981 U.S. AMI installations in 2024, including 16,529,599 commercial meters (EIA Table 10.05).
- EIA’s 2022 FAQ put AMI at about 119 million installations, 72% of U.S. electric meters (EIA FAQ, updated 20 Oct 2023).
- RadiusPoint has published $1,500 a month ($18,000 a year) recovered from utilities at closed locations, a published facilities proof point.
- An elevator-industry client cut monthly waste expenditure 28% on RadiusPoint’s published record, which is a contract-and-tariff finding, not a tenant-transfer finding.
The Short Version
- List every meter behind the account, not just the account number.
- Confirm the meter is live and the multiplier or CT ratio matches the field tag.
- Test the rate class against the load profile and the signed contract.
- Recompute kWh, kW, and any ratchet from interval or register data.
- File the exception with the utility and keep it open until the credit posts.
| Check | Account review | Meter audit |
|---|---|---|
| Unit of work | Vendor account | Meter number |
| Catches | Duplicate bills, late fees | Multiplier, tariff, demand |
| Misses | Wrong rate class | Almost none of the above |
| Output | Pay or hold | Dispute plus rate correction |
In This Article
- Meter Level Is the Unit of Work
- What does a tariff check actually test?
- How do you test demand and a ratchet?
- Which utility errors show up at meter level?
- How RadiusPoint Runs Utility Expense Management
- What This Page Is Not
- Frequently Asked Questions
Meter Level Is the Unit of Work
A utility audit starts at the meter number because that is the device the tariff and the kWh attach to. RadiusPoint’s live UEM copy says the audit happens at meter level, not account level, which is the technical detail that separates real UEM from generic AP processing.
ExpenseLogic audits each invoice by account number, then by service ID (phone, circuit, or meter number), then by each charge on that service ID. For utilities, the service ID is the meter. If you stop at the account, a four-meter site looks like one clean bill.
EIA does not publish natural gas or water meter counts in the electric AMI FAQ, which is a useful limit: electric interval data is the richest feed, and gas, water, sewer, and waste still need a register-level check. RadiusPoint’s UEM scope is electricity, gas, water, sewer, and waste.
Sharon Watkins founded RadiusPoint in 1992 to manage telecom, technology, and utility expenses together. The meter grain is not a 2026 slogan. It is why the platform stores a site and utility equipment database.
What does a tariff check actually test?
A tariff check tests whether this meter’s rate class, riders, and contract price match the signed agreement and the load the site actually runs. RadiusPoint’s UEM audit types are contract and tariff rate audit, consumption-based audit, and threshold-based audit.
Wrong rate class is the expensive miss. A general-service schedule on a site that qualifies for a time-of-use or industrial class will look consistent every month, so a variance control never fires. Demand multipliers for kilowatt analysis matter in retail and hospitality, which is why RadiusPoint already names those verticals on the UEM page.
The capability statement lists tariff and rate class review next to meter-level invoice audit. Rate reclassification is a later article. This section only asks whether the class on the bill is the class the meter earned.
Energy Star participation is named on the live capability page as a reporting support point, not as a savings claim. Line-item invoice detail is what makes Scope 2 reporting possible. An unaudited tariff makes the carbon number as fictional as the dollar number.
How do you test demand and a ratchet?
You test demand by recomputing billed kW from interval data, then checking any ratchet or contract minimum that changed the dollars. RadiusPoint’s threshold-based audit is the sibling control: a spike that is real still has to be billed under the right rule.
A ratchet can bill this month on a peak that happened last August. Tariform’s demand-extraction note is the practical warning: the billed kW may not appear on this invoice at all. If your AP file only stores the dollar total, you cannot test the ratchet.
EIA’s 2024 commercial AMI count (16,529,599) is the pool of sites where interval data should make this test cheaper than it was on a monthly register. Estimated reads that are never trued up remain the analog failure, especially on hard-to-access meters.
A multi-location RadiusPoint client published $1,500 per month from utilities at closed locations. That is a consumption-of-zero test the account-level review will not run, because the account still looks open.
Which utility errors show up at meter level?
Meter-level utility errors cluster into eight types because utilities bill from configuration, not from intent, and the list repeats. RadiusPoint analysts research each exception with the vendor and track the credit until it posts, the same pending-credit discipline ExpenseLogic uses on telecom.
- Incorrect meter multiplier or CT ratio after a swap.
- Wrong rate class or outdated tariff.
- Demand ratchet or contract minimum applied after a one-off spike.
- Estimated read never replaced with an actual.
- Sales tax on an exempt manufacturing or nonprofit account.
- Rider billed after the site no longer qualifies.
- Zombie meter at a closed, sold, or demolished site.
- Contract price that does not match the signed agreement.
Vacancy cost recovery decreasing utility expenses by 12% is a published RadiusPoint published figure. It belongs to the vacant-cost-recovery page. It is listed here only so you do not treat a tenant-transfer miss as a tariff win.
An elevator company on RadiusPoint’s published record reduced monthly waste expenditure 28%. Waste is in the UEM scope. It is a contract-and-container audit, still at service-ID grain.
How RadiusPoint Runs Utility Expense Management
RadiusPoint runs utility expense management on ExpenseLogic as invoice receipt, meter validation, site allocation, and open-close help desk work. The about RadiusPoint page is the company story. This section is the operating loop.
ESG reporting that eliminated 800 man-hours of data gathering is a published proof point. That number is about line-item utility detail, which is the same extract a meter audit produces. It is not a promise that your next audit saves 800 hours.
Capterra rates ExpenseLogic 4.8 from 31 reviews through December 2025 (Capterra). Amalgam Insights named RadiusPoint a Distinguished Vendor on the 2024 TEM Vendor SmartList. ISO 9001 has been in place since September 2002. Use those as process signals, not as a utility refund forecast.
Gartner’s July 2026 communications figure ($1.354 trillion) is a telecom market number. It is here only to mark the boundary: this audit is electric, gas, water, sewer, and waste. Telecom expense management is the sibling discipline, not this checklist.
What This Page Is Not
A utility bill audit asks whether the meter, the tariff, and the kWh agree.
Do not treat a closed-location finding as proof you have a tariff practice. Do not treat a tariff win as proof the tenant transferred. The triad keeps those jobs apart.
Ask RadiusPoint to audit one month of meters at one site. If the work product cannot name the meter number, the CT ratio, and the rate class, it was an AP review.
Frequently Asked Questions
Is a year-over-year account variance an audit?
No. Variance against last month only catches jumps. A wrong CT ratio that has been stable for three years looks like the baseline. Test the meter.
Do smart meters remove the need to audit?
No. EIA’s 2024 AMI count shows how common interval data is. The data still has to be read against the tariff and the multiplier. A smart meter can bill a ratchet with more precision, not less.
What about gas, water, sewer, and waste?
The same grain applies: service ID, contract, and consumption. EIA’s electric AMI FAQ does not cover those meters, so you will lean on registers, haul tickets, and signed rates. RadiusPoint’s UEM scope includes all five.
How is this different from vacant cost recovery?
Vacant cost recovery asks who owes the bill after a tenant leaves. A utility bill audit asks whether the bill is correct for the meter that is still there. Different question, different page.
How is this different from a telecom invoice audit?
Telecom audits reconcile invoice, contract, and circuit or line inventory. Utility audits reconcile invoice, tariff, and meter inventory. RadiusPoint runs both on ExpenseLogic. Do not copy a CSR checklist onto an electric bill.
Pull Twelve Months of One Meter
Start with the messiest site you have, and write down the meter number, multiplier, rate class, and billed kW before you pay. Write down the meter number, the multiplier, the rate class, and the billed kW. If any of those four is missing, you do not have an audit file yet.
Request a demo of ExpenseLogic and ask to see a meter-level exception. Every month this goes unread is another month the same configuration bills at the same wrong rate.
References
- Table 10.05. Advanced Metering Count by Technology Type, 2015 through 2024 | U.S. Energy Information Administration
- How many smart meters are installed in the United States, and who has them? | EIA FAQ, updated 20 October 2023
- ExpenseLogic | Capterra
- Utility Expense Management | RadiusPoint
- ExpenseLogic | RadiusPoint
- Telecom Expense Management | RadiusPoint
- About | RadiusPoint
- RadiusPoint Capability Statement | RadiusPoint
- Sharon Watkins | RadiusPoint
Related Reading
This article is educational. RadiusPoint does not guarantee refunds, tariff changes, or consumption reductions. Figures were current as of 28 August 2026.
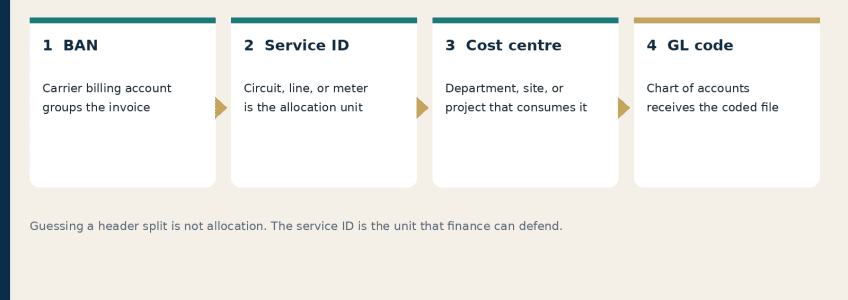
Allocating Telecom and Utility Costs Across Departments
By Sharon Watkins, Founder and CEO, RadiusPoint · 20 August 2026
Finance teams allocate telecom and utility spend by mapping each service ID to a cost centre, then writing a coded general ledger file. A controller who dumps one billing account number into a catch-all account is coding, not allocating, and the departments will spend the next close arguing about a number nobody can defend.
Cost allocation is the rule that splits a live service across the people and sites that use it, then lands that split in the chart of accounts. GL coding is the last step, not the method. RadiusPoint builds the map inside ExpenseLogic so the file AP posts is already split.
Key Takeaways
- Allocation starts at the service ID (circuit, wireless line, or meter), not at the invoice header or the BAN.
- RadiusPoint can split any charge across multiple cost centres or locations, a live ExpenseLogic FAQ claim.
- ExpenseLogic accounts payable and allocation lists allocation and accrual files as a core AP module, comparable to PeopleSoft and Great Plains interfaces.
- A Fortune 100 manufacturer on RadiusPoint’s published record has more than 10,000 wireless devices managed globally, which is an allocation problem before it is an audit problem.
- Gartner forecast worldwide communications services spend at $1.354 trillion for 2026, up 4.4% from 2025 (Gartner newsroom, 27 July 2026).
The Short Version
Map every circuit, line, and meter to an owner, apply a written split rule, then export a coded GL file. Do not guess a header percentage after the invoice arrives.
| Step | Unit | What finance gets |
|---|---|---|
| 1. BAN | Carrier account | The invoice envelope |
| 2. Service ID | Circuit, line, or meter | The thing being paid for |
| 3. Cost centre | Department, site, project | Who consumes it |
| 4. GL code | Chart of accounts | Where the file posts |
In This Article
- The Service-ID Allocation Stack
- How do you split one circuit across many cost centres?
- Why does a header split fail at month-end?
- How do you allocate a wireless line after someone leaves?
- Utility Meters Need a Different Grain
- What RadiusPoint Puts in the Interface File
- Frequently Asked Questions
The Service-ID Allocation Stack
Finance allocates recurring spend by stacking four records: billing account, service ID, cost centre, and GL code, in that order. RadiusPoint treats the service ID as the unit because that is what the carrier bills and what the inventory can prove.
ExpenseLogic stores vendors, invoice detail, payment detail, and asset inventory in one portal so the stack does not live in four spreadsheets. The RadiusPoint capability statement names cost allocation and accounting integration as a core competency: rules-based allocation to cost centre, location, and general ledger account, with coded output into the client’s ERP.
A header split (“put 30% of this BAN on marketing”) fails the first time a circuit moves or a store closes. The stack fails later, and it fails with a ticket, because the owner sits on the inventory row.
Education and higher learning are the vertical RadiusPoint already flags for chargeback complexity and manager authorisation workflows. That is the same stack with more cost centres, not a different product.
How do you split one circuit across many cost centres?
You split a shared circuit by writing a percentage rule on the service ID and applying it every cycle until owners change. RadiusPoint’s live TEM FAQ states that any charge can be split between multiple cost centres or locations.
A worked example, invented only as arithmetic on a published capability (circuit split-billing), not as a client result: a $4,800 MPLS circuit used by Finance (25%), Operations (40%), Sales (20%), and an IT backbone share (15%) becomes $1,200 / $1,920 / $960 / $720. The next month uses the same rule unless a MACD ticket changes the owners.
That is chargeback. Chargeback is the conversation with the department. Allocation is the rule that makes the conversation short. RadiusPoint’s telecom expense management lifecycle already lists cost allocation next to invoice audit and payment.
Client growth from 170 to 1,200 locations is a published RadiusPoint scalability proof. At that span, a shared circuit without a written split becomes a monthly argument, not a file.
Why does a header split fail at month-end?
A header split fails at month-end because the BAN no longer matches who used each circuit or meter this period. RadiusPoint will create an upload file that interfaces with the client’s current accounting software for proper allocation, which is the live FAQ answer to “will our AP team key this.”
Coding without a split dumps the BAN into one account and leaves finance to journal the rest. That is the pain the AP director already has: volume, exceptions, manual GL coding, late fees. ExpenseLogic’s AP module is built to remove the keying, not to invent a new chart of accounts.
Gartner’s July 2026 forecast puts worldwide IT spend at $6.37 trillion and communications services at $1.354 trillion (Gartner, 27 July 2026). A 4.4% rise in communications spend is a budget variance problem if last year’s dump account is this year’s “actual.”
Three-way match asks whether the invoice agrees with a purchase order. Allocation asks which cost centre owns a service that never had a purchase order.
How do you allocate a wireless line after someone leaves?
You allocate a departed employee’s wireless line to that person’s last cost centre, then stop the billing and recover leftover months. RadiusPoint’s managed mobility services invoice processing is allocated down to phone number and Employee ID for that reason.
ExpenseLogic can validate a monthly HR roster of valid employee IDs against devices and lines in the repository. That is an allocation control, not a mobility slogan. A food service client on RadiusPoint’s published record had more than 600 lines audited and a 22% cost reduction ($400,000 year one). Those lines had to land somewhere after the audit.
A Fortune 100 wireless discovery story on the same published record shows $830,000 in annual savings. Discovery without allocation just moves the leak into a different GL bucket.
Capterra lists ExpenseLogic at 4.8 from 31 reviews through December 2025 (Capterra, ExpenseLogic). Reviewers who care about AP files care about this grain, not about a dashboard colour.
Utility Meters Need a Different Grain
Utility allocation belongs on the meter number and the site, because one vendor account can hide five meters and a vacant wing. RadiusPoint’s utility expense management (UEM here means Utility Expense Management, not Unified Endpoint Management) allocates cost to location, department, and meter number.
A multi-location RadiusPoint client published $1,500 a month, $18,000 a year, from utilities at closed locations. That finding is an allocation failure first: the meter was still mapped to an open cost centre. This page only needs the grain: meter, not account.
EIA counted 16,529,599 commercial AMI meters in 2024, inside 140,491,981 total AMI installations (EIA Electric Power Annual, Table 10.05). More interval data does not allocate itself. Someone still has to own the meter in the file.
RadiusPoint also houses deposit information by meter and service type, which is another allocation-adjacent record AP rarely sees until a site closes and the deposit never returns.
What RadiusPoint Puts in the Interface File
RadiusPoint delivers a coded upload file on the client’s own chart of accounts, ready for AP to load without re-keying lines. ExpenseLogic writes the spec file to the client’s ERP (PeopleSoft, Great Plains, JD Edwards, and others named on the certifications page) so AP does not re-key.
Sharon Watkins founded RadiusPoint in January 1992 and still treats ExpenseLogic as the place the allocation rule lives. The company’s published posture is software plus people: analysts maintain the inventory so the file stays true after a move.
ISO 9001 certification since September 2002 is the process claim behind a file you can hand an auditor. Amalgam Insights named RadiusPoint a Distinguished Vendor on the 2024 TEM Vendor SmartList. Neither fact is a savings guarantee. Both are reasons the interface file is a product, not a favour.
Ask for one month of invoices allocated at service-ID grain. If the file cannot name the circuit, the line, or the meter, it is a journal entry dressed as TEM.
Frequently Asked Questions
Is GL coding the same as cost allocation?
No. GL coding is the account the journal hits. Allocation is the rule that decides how much of a circuit, line, or meter belongs to each cost centre before that account is chosen. RadiusPoint runs the rule, then writes the code.
Can one circuit hit more than one department?
Yes. RadiusPoint’s live FAQ says any charge can be split across multiple cost centres or locations. The split sits on the service ID so it repeats every cycle until a ticket changes the owners.
Where do wireless lines get charged?
To the phone number and the employee ID, then to that person’s cost centre. Pooled BAN totals cannot survive an offboarding month. ExpenseLogic can test a monthly HR roster against the inventory.
How should utility invoices be allocated?
At meter number and site, not at the vendor account. Utility expense management (not Unified Endpoint Management) is the RadiusPoint name for that grain. Closed-location bills are an allocation miss before they are a recovery project.
What does AP actually receive from RadiusPoint?
An upload file specified during setup, coded to the client’s chart of accounts, so the team does not key invoice lines.
If the File Cannot Name the Circuit, Stop
Allocation that starts at the BAN will be re-litigated every close, because no service ID owns the dollars on that file. Start at the service ID, write the split, export the file.
Request a demo of ExpenseLogic and ask to see one circuit split and one meter coded. Sharon Watkins has been building that file since 1992. The cost of another guessed header is another month of the same argument.
References
- Gartner Forecasts Worldwide IT Spending to Grow 14.2% in 2026, Totaling $6.37 Trillion | Gartner newsroom, 27 July 2026
- Table 10.05. Advanced Metering Count by Technology Type, 2015 through 2024 | U.S. Energy Information Administration
- ExpenseLogic | Capterra
- ExpenseLogic | RadiusPoint
- Telecom Expense Management | RadiusPoint
- Utility Expense Management | RadiusPoint
- Managed Mobility Services | RadiusPoint
- RadiusPoint Capability Statement | RadiusPoint
- Sharon Watkins | RadiusPoint
Related Reading
- ExpenseLogic accounts payable and allocation
- Telecom expense management
- Utility expense management
- RadiusPoint capability statement
This article is educational. RadiusPoint does not guarantee savings, allocations, or close dates. Figures were current as of 28 August 2026.
Wireless Expense Management vs Telecom Expense Management
By Sharon Watkins, Founder and CEO, RadiusPoint · 17 August 2026 · 11 min read
Wireless expense management is the mobile-billing discipline inside telecom expense management; TEM still owns wireline, data, contracts, and the GL file. Your organization negotiated a wireless rate. Your organization isn’t being billed at that rate on every handset. Both can be true for 18 months. RadiusPoint runs WEM and TEM on ExpenseLogic so finance isn’t buying two truths.
This page is a comparison. It isn’t TEM 101. For the definition of the parent category, use What Is Telecom Expense Management?. It’s also not WEM versus MDM. Device security is a different buy.
Key Takeaways
- ETMA describes wireless expense management as a special category of TEM focused on wireless services and mobile devices. Wikipedia calls WEM an extension of TEM.
- RadiusPoint’s Fortune 100 wireless program recovered more than $450,000 in refunds and continues to save more than $830,000 a year.
- A RadiusPoint food service mobility engagement cut cost 22%, more than $400,000 a year, across 600-plus lines.
- WEM is billing, plans, zero-use, and Employee ID. TEM is that work plus wireline, data circuits, allocation, and bill pay.
- Managed mobility services sit beside both: staging, repair, recovery. RadiusPoint delivers all three through ExpenseLogic.
The Short Version
Buy WEM when the estate is handsets and pooled data. Buy TEM when the estate also includes circuits, BANs, and a month-end file. Buy MMS when you also kit and retire the device. RadiusPoint will run the mix you actually have.
In this article
- The difference in one table
- What does wireless expense management cover that TEM doesn’t own alone?
- Where TEM still includes wireless billing
- When do you need WEM instead of a full TEM program?
- How WEM, TEM, and managed mobility services stack
- Why do buyers confuse WEM with TEM in RFPs?
- How RadiusPoint runs both inside ExpenseLogic
The difference in one table
The difference is scope: WEM is the wireless invoice, plan, and user record, and TEM is the whole communications estate those wireless lines sit inside. RadiusPoint keeps both scopes in ExpenseLogic so a controller can see a handset MRC and a circuit MRC on one allocation file. ETMA is the clean third-party sentence: WEM programs are a special category of TEM programs with a focus on wireless services and mobile devices.
| Question | Wireless expense management | Telecom expense management |
|---|---|---|
| What is billed | Mobile voice, data, SMS, hotspots, tablets | Wireline, wireless, data circuits, and related taxes |
| Inventory key | Phone number, IMEI, Employee ID | Service ID, BAN, site, plus wireless keys |
| Typical failure | Zero-use and ex-employee lines | Failed disconnects, rate misses, duplicate circuits |
| Output finance wants | Line-level allocation and plan fit | Accrual file, GL file, paid and coded invoices |
| RadiusPoint published proof | $830,000 annual wireless run-rate; 22% / $400,000 mobility | $450,000 year-one telecom refunds on a Fortune 100 estate |
A glass manufacturer working with RadiusPoint saved more than $100,000 on telecom. That’s TEM proof. The $830,000 figure is WEM proof. Don’t paste one into the other RFP.
What does wireless expense management cover that TEM doesn’t own alone?
Wireless expense management covers Employee ID, rate-plan fit, roaming, pooled data, and zero-use flags a wireline-first TEM process will skip. RadiusPoint runs those flags in ExpenseLogic as a mobility workflow, then rolls the result into the TEM invoice file so AP still sees one vendor. TEM can include wireless. WEM is what you call the work when the wireless file is the job.
The food service case needed a Register Your Line portal, a wireless policy, and a 60-day registration window. That’s WEM operating cadence. A circuit audit doesn’t ask 600 people to claim a number. ExpenseLogic held the claimed set.
Teligistics and other WEM vendors contrast WEM with MDM. We aren’t repeating that contrast here. MDM is endpoint control. WEM is the bill. RadiusPoint will say that once and move on.
Where TEM still includes wireless billing
TEM still includes wireless billing because the wireless BAN is a telecom invoice, and the GL doesn’t care that the access method is radio. RadiusPoint’s telecom expense management service already lists line-item audit across wireline, wireless, and data. ExpenseLogic is the same platform. Calling the wireless slice WEM doesn’t pull it out of TEM. It names the specialist queue.
A Fortune 100 estate of about 10,000 wireless devices still needed TEM invoice processing, contract terms, and exception reporting. RadiusPoint’s published $450,000 refund pile sat next to the $830,000 annual exception savings. That’s one program with two labels.
Organizations implementing TEM typically see 15% to 30% cost reduction in year one. Treat that as a category range, not a RadiusPoint guarantee. WEM-only cleanups can land inside that range when the estate is almost all handsets.
When do you need WEM instead of a full TEM program?
You need WEM instead of full TEM when the unexplained spend is almost all mobile and the circuit file is already small. RadiusPoint will still load those wireless invoices into ExpenseLogic. You don’t need to buy a wireline project to retire 56 ex-employee lines. You do need TEM when AP is also coding MPLS, DIA, and toll-free on the same close.
| You’re here | Buy first | Why RadiusPoint frames it that way |
|---|---|---|
| Handsets, pooled data, HR mismatch | WEM | The food service 600-plus / 22% pattern |
| Circuits plus wireless plus a GL file | TEM | The Fortune 100 refund-plus-exception pattern |
| Devices must be kitted, repaired, retired | MMS beside WEM | Lifecycle isn’t a billing discipline |
| Electric, gas, water on the same team | UEM, not TEM | Utility Expense Management (UEM, not Unified Endpoint Management) |
How WEM, TEM, and managed mobility services stack
WEM sits inside TEM, and managed mobility services sit beside both as the device-lifecycle layer RadiusPoint runs on the same ExpenseLogic record. Managed mobility services cover procurement, staging, kitting, repair, recovery, and retirement. WEM covers the bill that follows the device. TEM covers that bill plus every other communications invoice. Confusing the three is how RFPs ask for “TEM” and evaluate a kitting warehouse.
| Layer | Owns | Doesn’t own |
|---|---|---|
| TEM | Inventory, invoice, contract, allocation, pay | Screwdriver work on a cracked screen |
| WEM | Wireless slice of TEM | Wireline circuits, utility meters |
| MMS | Device lifecycle and help desk | Tariff design on a fiber BAN |
Why do buyers confuse WEM with TEM in RFPs?
Buyers confuse WEM with TEM because every wireless invoice is a telecom invoice, and vendor marketing uses the two acronyms as synonyms. RadiusPoint writes the RFP response from the ExpenseLogic module list, not from the acronym in the subject line. If the statement of work is “audit AT&T and Verizon wireless, match HR, kill zero-use,” you’ve a WEM SOW. If it’s “process every BAN, allocate to cost center, produce an accrual file,” you’ve a TEM SOW.
A healthcare provider in RadiusPoint’s published case studies cut telecom expenses 26%. Read the case before you file it under WEM. Telecom is the parent. Wireless may be the slice that moved.
ISO 9001 has been in place at RadiusPoint since September 2002. The process name on the SOP is less important than whether ExpenseLogic holds the inventory of record. Ask for that file.
How RadiusPoint runs both inside ExpenseLogic
RadiusPoint runs WEM and TEM as one ExpenseLogic service: wireless gets Employee IDs, circuits get service IDs, AP gets one file. The about page still describes a company founded in 1992 to manage telecom, technology, and utility expenses. Utility Expense Management stays on its own UEM page. Don’t fold electric BANs into a WEM buy.
Capterra listed ExpenseLogic at 4.8 from 31 reviews through December 2025. Amalgam Insights named RadiusPoint a Distinguished Vendor on the 2024 TEM Vendor SmartList. Those anchors describe the firm. The $830,000 and the 22% describe the wireless slice.
Sharon Watkins is the founder who still sits with the software team. The comparison she wants buyers to make isn’t WEM versus TEM as a religious war. It’s “which layer is failing this quarter,” then load that layer into ExpenseLogic.
FAQ
Is WEM a subset of TEM or a separate buy?
Functionally a subset. Commercially a separate SOW when the estate is almost all mobile. RadiusPoint will sell the slice or the parent and still use ExpenseLogic.
Does WEM include device procurement?
Not by itself. Procurement, staging, and repair are managed mobility services. RadiusPoint will attach MMS when the device, not only the bill, is the problem.
Can one platform do WEM and wireline TEM together?
Yes. ExpenseLogic is built for that join. That’s the point of RadiusPoint’s single-platform pitch against buying a wireless tool and a circuit tool.
How is WEM different from rate-plan optimization software?
Rate-plan software suggests a cheaper plan. WEM, as RadiusPoint runs it, also matches HR, kills zero-use, files disputes, and allocates the invoice. A suggestion without a disconnect ticket is a slide.
Do utility invoices belong in TEM or in WEM?
Neither. They belong in Utility Expense Management (UEM, not Unified Endpoint Management). RadiusPoint will take the electric BAN on the UEM side of ExpenseLogic.
What to do with the next RFP
Rewrite the first paragraph so it names handsets, circuits, or both. Send that paragraph to RadiusPoint. ExpenseLogic can be scoped to the sentence you actually wrote.
References
- What is Wireless Expense Management (WEM)? | ETMA
- Wireless Expense Management | Wikipedia
- ExpenseLogic | RadiusPoint
- What Is Telecom Expense Management? | RadiusPoint
- Telecom Expense Management | RadiusPoint
- Managed Mobility Services | RadiusPoint
- Utility Expense Management | RadiusPoint
- About RadiusPoint | RadiusPoint
- Sharon R. Watkins | RadiusPoint
- Wireless Expense Management Yields $830K in Annual Savings | RadiusPoint
Related articles
- What Is Telecom Expense Management?
- Managed Mobility Services
- Telecom Expense Management
Disclaimer
This article is general information for finance and telecom buyers. It is not a vendor-selection guarantee. Outcomes cited are from specific RadiusPoint client engagements in RadiusPoint’s published case studies. Category ranges are not RadiusPoint promises.

Finding and Killing Zero-Use Mobile Lines
By Sharon Watkins, Founder and CEO, RadiusPoint · 13 August 2026 · 12 min read
Zero-use mobile lines are corporate numbers that still bill every month after the user, the device, or both have already left. How many mobile lines does your company pay for right now, not approximately, exactly? Most finance teams can’t answer inside a week. RadiusPoint finds those lines by matching the carrier BAN to the HR roster inside ExpenseLogic, then tickets the disconnect so the charge dies.
This is a method page for ex-employee lines and ghost lines. It isn’t a restatement of managed mobility services, and it isn’t a mobility-pillar rewrite.
Key Takeaways
- A food service client of RadiusPoint had 600-plus phones billed with no employee attached. RadiusPoint’s published case cut monthly cost 22%, more than $400,000 a year.
- That same audit found 56 people who were no longer employed, some gone more than two years, with lines still live.
- Registration ran for 60 days on a Register Your Line portal. The pass took two months.
- A Fortune 100 wireless program with RadiusPoint recovered more than $450,000 in refunds and continues to save more than $830,000 a year.
- The HR-Roster Triple Match uses three keys: Employee ID, phone number, and a 0 / 90 / 180 day usage window.
The Short Version
- Load every wireless BAN into ExpenseLogic.
- Match each number to the current HR roster and a device.
- Flag zero-use, ex-employee, and unowned lines.
- Protect system lines (alarm, elevator, POS) before anyone clicks disconnect.
- Suspend, then disconnect, then prove the later invoice is clean.
In this article
- What a zero-use mobile line actually is
- How do you find ex-employee lines still billing?
- The HR-Roster Triple Match
- How are ghost lines different from zero-use lines?
- Lines you should not kill without a second check
- What happens after you submit the disconnect?
- How RadiusPoint and ExpenseLogic retire zero-use lines
What a zero-use mobile line actually is
A zero-use mobile line is a corporate BAN number with no real voice, data, or SMS use in the window you chose. RadiusPoint reads that window from the carrier invoice inside ExpenseLogic, not from a manager’s memory. Zero use is a usage fact. It isn’t yet a kill order. Some quiet lines are spare pool. Some are failover. Some are an employee who left in March.
RadiusPoint’s food service case started with 600-plus phones and no identification of the people using them. That’s the zero-use problem at inventory scale. ExpenseLogic is where the usage column and the Employee ID column finally sit on one row.
A Fortune 100 client brought RadiusPoint about 10,000 wireless devices. At that count, a 1% ghost rate is 100 bills. You won’t find them with a sample.
How do you find ex-employee lines still billing?
You find ex-employee lines by matching every live wireless number to this month’s HR roster, then ticketing every miss. RadiusPoint runs that match in ExpenseLogic against Employee ID first, name second, cost center third. The food service case found 56 identified users who were no longer employed, plus another set of more than 50 lines with no company association. Those are published counts, not a model.
RadiusPoint built a Register Your Line portal for that client. Corporate mailed users and said unregistered lines would cancel after 60 days. The pass took two months because the roster was thin. ExpenseLogic then held the registered set as the inventory of record.
Rogue phones bought at a store and expensed at non-contract rates sat about 30% higher than the corporate plan. RadiusPoint ported those onto the contract. Finding the person is how you find the rate too.
The HR-Roster Triple Match
The HR-Roster Triple Match is RadiusPoint’s three-key test: Employee ID, phone number, and a dated usage window of 0, 90, or 180 days. ExpenseLogic stores the three keys so a miss becomes a typed exception. Mobile-audit blogs say “compare the roster.” They don’t name a three-key test with three usage windows. That’s the first.
| Key | Source RadiusPoint loads | Fail looks like |
|---|---|---|
| Employee ID | Monthly HR feed into ExpenseLogic | Line has a name, ID is termed |
| Phone number | Carrier BAN / invoice | Number on bill, no roster row |
| Usage window | 0 / 90 / 180 days of voice, data, SMS | Zero use, or only background bytes |
Zero days is a same-cycle flag. Ninety days is the default kill-candidate window RadiusPoint uses unless the client policy says otherwise. One hundred eighty days is for seasonal and spare-pool lines you refuse to drop on a quiet quarter. The window is a policy choice. The match isn’t.
How are ghost lines different from zero-use lines?
A ghost line has no living user and no living device, while a zero-use line may still have both and simply sit unused. RadiusPoint codes the two failures separately in ExpenseLogic because the next action differs. An ex-employee line has a person to collect a handset from. A ghost line has a BAN row and a shrug. The food service case had lost devices still billed, in-stock devices billed with no user, and pagers nobody would own. Those are ghosts.
The Fortune 100 wireless case used a Register Your Line database to attach identification codes, cost centers, and Employee IDs. That’s how RadiusPoint turns a ghost into either a named asset or a disconnect. ExpenseLogic keeps the attachment so the ghost can’t reincarnate next quarter.
Craft and other ghost-line essays quote $30 to $55 per unused mobile plan. We aren’t repeating those figures. RadiusPoint’s own published dollars on this problem are the 22% / $400,000 food service outcome and the $830,000 Fortune 100 run-rate.
Lines you should not kill without a second check
You should not kill a quiet line that serves an alarm, elevator, payment terminal, or failover path until someone names the system owner. RadiusPoint puts a system-line hold in ExpenseLogic so a zero-use flag can’t auto-ticket a disconnect. Ghost-line checklists mention alarms. They don’t give you a three-bucket taxonomy next to RadiusPoint’s published 56-person miss.
| Bucket | What ExpenseLogic should show | Default action |
|---|---|---|
| Ex-employee | HR termed, number still billed | Suspend, recover device if you can, disconnect |
| Ghost | No user, no device, no use | Disconnect after a 90-day window |
| System line | Named system, site, and owner | Keep, review annually |
The food service team could not recover some older handsets and let the hardware go. They still killed the service. Hardware loss is a sunk cost. The MRC isn’t.
What happens after you submit the disconnect?
After you submit the disconnect, you still have to prove the later invoices dropped the MRC, or you’ve only filed a hope. RadiusPoint keeps the wireless ticket open in ExpenseLogic through the next two cycles, the same closeout idea used on circuits. A food service line that belonged to someone gone two years had already leaked 24 MRCs. Closing the portal request doesn’t claw those back by itself. A dispute might.
RadiusPoint’s telecom expense management team files those disputes when the LOA allows it. The mobility team tickets the disconnect. ExpenseLogic is the shared record so the two teams don’t close different truths.
Annual line registration is how RadiusPoint stops the pile from growing back. One 60-day pass is a cleanup. A yearly pass is a control.
How RadiusPoint and ExpenseLogic retire zero-use lines
RadiusPoint retires zero-use mobile lines as a managed ExpenseLogic workflow: confirm the bucket, then prove later invoices dropped the MRC. Capabilities already on the mobility page include zero-use identification, ex-employee detection against an HR roster, annual line registration, and invoice allocation to phone number and Employee ID. This page is the method those capabilities execute.
Sharon Watkins built RadiusPoint around invoice truth, not around a dashboard. The food service client had one person who also had other telecom duties. ExpenseLogic plus a named RadiusPoint analyst is how 600-plus lines become a file you can defend.
Capterra listed ExpenseLogic at 4.8 from 31 reviews through December 2025. Amalgam Insights named RadiusPoint a Distinguished Vendor on the 2024 TEM Vendor SmartList. Use those as third-party anchors. Use the 56 and the 22% as the operating anchors.
FAQ
How many months of zero usage before you disconnect?
RadiusPoint defaults to a 90-day window unless your wireless policy says otherwise. Seasonal roles and spare pools can sit on 180 days. Same-cycle zero use is a flag, not a kill.
Can you recover months of charges on an ex-employee line?
Sometimes, if the carrier’s dispute window still covers the tail and the LOA lets RadiusPoint file. The food service lines that had run more than two years were a stop-the-bleeding win more than a full clawback. ExpenseLogic keeps the dates so you know which months are even eligible.
Do tablets and hotspots count as zero-use lines?
Yes. RadiusPoint inventories smartphones, tablets, wearables, and the pagers that still haunt older estates. A quiet hotspot on a closed site is a ghost with a different shape.
Should you suspend first or disconnect immediately?
Suspend first when a device might come back or a legal hold exists. Disconnect when the Triple Match says ghost or termed, and the system-line hold is clear. RadiusPoint writes the choice on the ExpenseLogic ticket.
How does annual line registration prevent ghost lines from returning?
It forces every live number to grow an Employee ID once a year. Unregistered lines age into disconnects. RadiusPoint’s 60-day food service pass is the template. ExpenseLogic holds the registered set so HR changes don’t wait for the next crisis.
What to do before the next wireless bill
Export last month’s BAN and this month’s HR file. If RadiusPoint can’t match them in ExpenseLogic inside a week, you already know the answer to “how many lines do we pay for.”
Latest Updates
- 13 August 2026: Article drafted. 600-plus lines, 22%, $400,000, 56 ex-employees, 60-day window, two-month pass, 30% rogue-rate gap, 50-plus extra lines, Fortune 100 $450,000 refunds and $830,000 annual, 10,000 devices, Capterra 4.8 / 31, Amalgam Insights 2024.
References
- How Managed Mobility Services Cut Costs 22% ($400K in Year 1) | RadiusPoint
- Wireless Expense Management Yields $830K in Annual Savings | RadiusPoint
- Managed Mobility Services | RadiusPoint
- Telecom Expense Management | RadiusPoint
- Sharon R. Watkins | RadiusPoint
- About RadiusPoint | RadiusPoint
- ExpenseLogic reviews | Capterra
Related articles
- Managed Mobility Services
- How Managed Mobility Services Cut Costs 22%
- Telecom Expense Management
Disclaimer
This article is general information for finance, HR, and mobility teams. It is not a promise that every zero-use line can be recovered or disconnected on a set timeline. Outcomes cited are from specific RadiusPoint client engagements already published.

Telecom Letter of Agency: What It Authorizes, and How to Scope It Safely
A telecom letter of agency (LOA) is a signed document that authorizes a third party to act on your behalf with your carriers, most often to obtain customer service records and file billing disputes. Under FCC rules a carrier must act on a valid LOA within 60 days, and the document controls exactly how much power you hand over. Scoped narrowly, it lets an auditor read your records and dispute wrong charges. Scoped loosely, it can also let someone order, change, and disconnect your services, which is far more authority than a records review needs.
The name is the first thing people get wrong, and it matters. Many vendors call this a Letter of Authorization, but the FCC’s official term in federal statute is Letter of Agency. They describe the same document, and the confusion is harmless right up until a carrier rejects a form for not matching the exact wording or record on file.
Key Takeaways
- An LOA authorizes a third party to obtain your carrier records and act on your account. Its scope is a choice, not a fixed template.
- For an audit or expense program, scope it to record access and dispute filing only, never to ordering or disconnecting services.
- The details on the LOA must match the carrier’s account record exactly, or the request gets rejected.
- The records it unlocks, customer service records, are the ground truth an audit reconciles against.
- Number-porting LOAs and audit LOAs look similar but grant different powers. Read which one you are signing.
Short Version
The letter of agency is the key that lets a provider pull your carrier records and dispute charges without you sitting on every call. The only real decision is scope. Grant enough to read records and file disputes, and no more. A well-written LOA is narrow, specific, and time-bound; a risky one authorizes actions you never intended.
What a Letter of Agency Authorizes
A letter of agency appoints a named third party as your agent with your carriers for a defined set of actions over a defined period. At minimum, an audit-focused LOA authorizes release of your customer proprietary network information, defined in federal law as 47 U.S.C. section 222, which includes billing records, service records, and account details. That release is what lets an auditor see what you are actually being charged for, line by line.
The reason scope matters is that some LOAs go much further. Broad templates authorize the agent to order, change, and maintain services across every carrier, which is convenient for a provider and dangerous for a client who only wanted a records review. The safe default is explicit: read the records, file the disputes, touch nothing else.
The Two LOAs People Confuse
A porting LOA and an audit LOA share a format but grant different authority, and signing the wrong one causes different problems. Knowing which you are handing over is the whole point.
| Porting LOA | Audit / expense LOA | |
|---|---|---|
| Purpose | Move phone numbers to a new carrier | Obtain records and dispute charges |
| Grants | Authority to initiate a carrier change | Authority to read records and file disputes |
| Main risk | Data mismatch rejects the port | Over-broad scope grants ordering rights |
| Should it allow disconnects? | Only the numbers being ported | No |
What the LOA Unlocks: Customer Service Records
The document is administrative, but what it unlocks is the most valuable data in a telecom audit. A customer service record, or CSR, is the carrier’s own account of the services provisioned on an account, and it regularly disagrees with both the invoice and your internal records. Reconciling those disagreements is where audit findings come from, and none of it is possible until the LOA authorizes the carrier to release the CSR. This is why record access is the first real step of any telecom refund recovery effort.
How to Fill and Scope One Correctly
A clean LOA process avoids the two failure modes, rejection and over-authorization, by getting the details right and the scope tight. Work through it in order.
- Copy details from a recent invoice. Use the exact account holder name, service address, and account number as the carrier has them, not your everyday business name.
- Name the agent precisely. State who is authorized and for which accounts or number ranges.
- Limit the actions. For an audit, authorize record access and dispute filing. Strike ordering, changing, and disconnecting.
- Set a validity window. Give the authorization explicit start and end dates rather than leaving it open-ended.
- Sign with authority. The signer must be the person authorized to obligate the account, or the carrier can reject it.
Getting the details right is not busywork. When the information on the LOA does not match the carrier’s record, the losing or holding carrier rejects it and returns a reason code, and the entire timeline slips while you correct a mismatched address or a missing account number.
Approval workflows that replace blanket ordering rights
Keep every add, move, change, and disconnect inside an ExpenseLogic ticket routed to your named approvers, so the Letter of Agency never becomes the only control on ordering.
The objection behind most broad grants is fair: if we do not authorize ordering, how does anything get done? Ordering still happens. It happens through a control you own rather than a permission you signed away. The LOA gives the carrier a reason to accept an order. Your approval workflow decides whether that order should be placed at all.
So every move, add, change, or disconnect (MACD) runs as a ticket. Someone requests the change, the request carries its cost and justification, and it routes to the approver you have designated for that cost center or site before anything reaches the carrier. Nothing is ordered on standing authority. RadiusPoint runs this inside ExpenseLogic, so the approval trail and the resulting inventory change live in the same system as the audit.
Under a scoped LOA, RadiusPoint pulls Customer Service Records, validates invoice lines against what is provisioned, and files disputes when a charge is wrong. That work runs on inquiry and dispute rights. When a change does need to happen, RadiusPoint opens a MACD ticket in ExpenseLogic, attaches the cost and the reason, and routes it to the approver you named, so the order reaches the carrier only after your approval posts.
Where the LOA Fits in a Telecom Program
The letter of agency is the authorization layer underneath most telecom expense work, which is why it usually gets signed early in onboarding. It enables the record pulls that feed inventory, it authorizes the disputes that recover money, and its scope should be coordinated with your MACD process so that ordering and disconnecting stay under internal control while records and disputes are delegated. When RadiusPoint begins a telecom engagement, the LOA is scoped to exactly that: authority to obtain customer service records and file disputes, gathered as part of the standard onboarding data set, with service-ordering authority deliberately left with the client.
Frequently Asked Questions
Is a Letter of Agency the same as a Letter of Authorization?
Yes, in practice. Letter of Agency is the FCC’s official term in federal regulation, and Letter of Authorization is a widely used synonym for the same document. Use whichever term your carrier’s form uses to avoid a wording mismatch.
How long is an LOA valid?
For as long as the document states, which is why you should set explicit start and end dates. Open-ended authorizations are harder to control and should be avoided for anything beyond a specific, time-boxed engagement.
Does an LOA let a provider disconnect our services?
Only if the LOA says so. A well-scoped audit LOA does not grant disconnect authority. If a template includes ordering, changing, or disconnecting language and you only want a records review, remove it before signing.
How fast must a carrier act on an LOA?
Federal rules require a carrier to submit a preferred carrier change order within 60 days of receiving a valid letter of agency. Most carriers act within days, but 60 days is the outer regulatory limit for carrier-change requests.
What information does an LOA require?
The account holder name as the carrier has it, the service address, the account number, the numbers or services in scope, a validity period, and an authorized signature. Pulling these from a recent invoice is the reliable way to match the carrier record.
Latest Updates
2 September 2026: Rewritten to center the audit and record-access use of the LOA, distinguish it from a porting LOA, and add explicit scoping steps that keep ordering and disconnect authority with the client.
References
- FCC, Letter of Agency terminology and preferred carrier change rules.
- 47 U.S.C. section 222, Customer Proprietary Network Information.
- Carrier LOA forms (Telnyx, FTS) illustrating CPNI release and broad-scope authorization language.
This article is general information and not legal advice. A letter of agency is a legal authorization; have counsel or a qualified advisor review scope and wording before signing anything that grants a third party authority over your accounts.

The MACD Process in Telecom Expense Management, Explained
By Sharon Watkins, Founder and CEO, RadiusPoint · 6 August 2026 · 12 min read
The MACD process in telecom expense management is the ticketed path for moves, adds, changes, and disconnects, and it fails most often on disconnects. The dispute was filed in April, resolved in September, and the overbilling had already run for 34 months on a circuit someone thought was dead. MACD is the change-control layer of telecom expense management: RadiusPoint records the request in ExpenseLogic, the carrier works the order, and finance doesn’t close the ticket until later invoices prove the charge is gone.
Key Takeaways
- MACD means moves, adds, changes, and disconnects. A disconnect that’s requested but never proven on a later invoice is still an open financial risk.
- RadiusPoint published $18,000 a year recovered by eliminating unneeded toll-free numbers, a classic failed-disconnect cousin.
- Inventory work at RadiusPoint has recovered $174,000 in re-credits when the record of services did not match the bill.
- The Disconnect Closeout Ladder has five rungs: request, firm order confirmation, final-bill sighting, invoice 2 and 3 proof, inventory retire.
- A Fortune 100 manufacturer working with RadiusPoint recovered $450,000 in telecom refunds in year one, with $850,000 in ongoing annual savings and a $1.3 million year-one impact.
The Short Version
A MACD ticket is finished when ExpenseLogic shows the service ID gone from the next invoices, not when someone clicked submit on the carrier portal.
In this article
- What MACD means in telecom expense management
- Why do disconnects fail so often?
- The Disconnect Closeout Ladder
- How do moves and adds create duplicate billing?
- What finance sees when a MACD ticket never closes
- Who should own MACD: IT, telecom, or accounts payable?
- How RadiusPoint tickets MACD inside ExpenseLogic
What MACD means in telecom expense management
MACD in telecom expense management is the four-type order set that changes the live inventory RadiusPoint bills against inside ExpenseLogic. A move relocates a service. An add provisions a new one. A change alters a feature, rate plan, or configuration. A disconnect is supposed to end the recurring charge. Outsourced telecom expense management is often bought because that four-type queue has outgrown the person who also runs the help desk.
MACD isn’t an ITSM label with a telecom accent. It’s the financial event that creates or kills a line on next month’s invoice. RadiusPoint keeps the ticket, the service ID, the BAN, and the promised due date in ExpenseLogic so the later invoice has something to match.
Organizations that implement TEM typically see 15% to 30% cost reduction in year one, a category range rather than a RadiusPoint promise. A large share of that range is inventory work, and inventory work is MACD that finally closed.
Why do disconnects fail so often?
Disconnects fail because carriers treat a submitted order as progress, while finance needs a stopped recurring charge on a later bill. RadiusPoint sees the same five breaks in ExpenseLogic: wrong service ID, wrong BAN, too little notice, the order sat in the wrong carrier queue, or provisioning stopped and billing did not.
Nothing on the invoice says “this charge is a ghost.” It looks like last month. RadiusPoint’s job is to hold the disconnect ticket open in ExpenseLogic until the charge is absent, then file for credit on the tail. Telecom audit services find disconnected-but-still-billing services as a first-audit staple. MACD is how you stop manufacturing the next crop.
RadiusPoint published $120,000 a year from contract rate optimization. That’s a rate problem. A failed disconnect is an inventory problem wearing a rate costume. ExpenseLogic has to test both.
The Disconnect Closeout Ladder
The Disconnect Closeout Ladder is RadiusPoint’s five-rung rule that a MACD disconnect is open until invoice three is clean of that service. ExpenseLogic is the ladder: each rung is a dated artifact, not a status emoji. Ranking MACD pages stop at “confirm billing stopped.” They don’t name a five-rung closeout that finance can audit. That’s the first.
| Rung | What RadiusPoint records in ExpenseLogic | Fail if |
|---|---|---|
| 1 Request | Written disconnect with service ID and BAN | Verbal only, or the ID is guessed |
| 2 Confirmation | Carrier FOC or equivalent | “Submitted” with no order number |
| 3 Final-bill sighting | Invoice language that this is a closing bill | Recurring MRC still present |
| 4 Invoice 2 and 3 | Two later cycles with zero recurring for that ID | The charge returns under a new USOC |
| 5 Inventory retire | Service removed from the ExpenseLogic inventory of record | Ticket closed, inventory still live |
Rung 4 is where most in-house programs quit. RadiusPoint doesn’t. A healthcare provider working with RadiusPoint cut telecom expenses 26%. Programs that skip rungs 4 and 5 give that money back.
How do moves and adds create duplicate billing?
Moves and adds create duplicate billing when the replacement service starts before the original service is proven dead on a later invoice. RadiusPoint treats every add that replaces a live circuit as a paired MACD in ExpenseLogic: one add ticket, one disconnect ticket, one shared due date. Site upgrades and SD-WAN overlays are the usual scene. The new circuit looks like progress. The old MPLS charge keeps hitting AP.
A glass manufacturer working with RadiusPoint saved more than $100,000 in year one at a 200% ROI, a published case. Duplicate services after a move are a standard way that kind of money hides. ExpenseLogic’s inventory of record is how RadiusPoint sees two service IDs on one address.
An automotive salvage client of RadiusPoint has a published $1.3 million outcome. Large estates don’t leak through one circuit. They leak through a hundred half-closed moves.
What finance sees when a MACD ticket never closes
Finance sees a variance it can’t explain, an accrual that’s wrong, and a late fee on a service nobody asked to keep. RadiusPoint writes those finance symptoms back onto the MACD ticket in ExpenseLogic so the telecom queue and the close calendar tell the same story.
| Finance symptom | MACD failure underneath | What ExpenseLogic should show |
|---|---|---|
| Unexplained MRC | Disconnect never completed | Open disconnect, service ID still billed |
| Accrual miss | Add installed, invoice late | Open add, no invoice match |
| Duplicate GL load | Move billed at old and new site | Two live IDs, one occupancy |
| Late fee | Dispute held, bill unpaid | Exception aging past the due date |
RadiusPoint’s TEM FAQ has long claimed a two-day invoice processing turnaround. That claim only helps if the MACD record is already in ExpenseLogic when the invoice lands. Otherwise the two-day cycle just pays the ghost faster.
Who should own MACD: IT, telecom, or accounts payable?
IT should request the change, telecom should run the carrier order, and accounts payable should wait on the ExpenseLogic result. RadiusPoint sits in the middle of that triangle as the managed operator. If any one group “owns MACD” alone, you get a completed ticket and a living charge.
A CIO wants the circuit moved. A telecom manager wants the FOC. A controller wants the MRC gone. All three are correct. RadiusPoint’s about story is software plus people for that exact split: ExpenseLogic holds the record, RadiusPoint chases the carrier.
Don’t hand a blanket letter of agency to whoever owns the ticket queue. Here the rule is simpler: the person who can click disconnect isn’t the person who can declare the invoice clean.
How RadiusPoint tickets MACD inside ExpenseLogic
RadiusPoint tickets MACD inside ExpenseLogic with client-defined approvals, carrier due dates, and a close rule that waits on later invoices. The MAC ticket system is a named ExpenseLogic module. Real-estate feeds can open and close services when a location opens or closes, which is how a vacant store and a dead circuit get the same treatment. RadiusPoint analysts work the exceptions. The client sees the ticket, not a portal full of homework.
A Fortune 100 manufacturer in RadiusPoint’s published case studies managed more than 10,000 wireless devices globally. Wireless MACD is the same ladder with an Employee ID on it. Wireline MACD is the same ladder with a circuit ID. ExpenseLogic holds both.
Sharon Watkins has said the telecom industry can’t keep up with the challenges and doesn’t have time to identify savings. MACD is where that sentence becomes a queue. RadiusPoint works the queue.
FAQ
What does FOC mean on a disconnect order?
FOC is the carrier’s firm order confirmation: a dated promise that the disconnect is accepted. RadiusPoint stores the FOC on the ExpenseLogic ticket as rung 2. It isn’t proof that billing stopped. It’s proof the carrier acknowledged the request.
How long should you keep a disconnect ticket open?
Keep it open through two later invoice cycles after the promised stop date. RadiusPoint’s ladder doesn’t retire the inventory in ExpenseLogic before that. A shorter window is how ghosts return under a new code.
Can you recover charges after a failed disconnect?
Often yes, inside the carrier’s dispute window, if RadiusPoint can show the request date, the FOC, and the invoices that kept billing. Recovery is a credit. Closeout is the control that stops the next 12 months.
Is MACD the same as a change request in ITSM?
No. An ITSM change request may move a configuration item. MACD is the carrier order and the invoice result. RadiusPoint will take an ITSM feed into ExpenseLogic. The ticket isn’t done when ITSM says done.
Do wireless line disconnects follow the same MACD path as circuits?
Yes on the ladder, no on the artifacts. Wireless uses a phone number and Employee ID. Circuits use a service ID and a site. ExpenseLogic holds both. The close rule is still later invoices.
What to do before the next invoice cycle
Pull every disconnect requested in the last 90 days. Ask RadiusPoint to load them into ExpenseLogic and run rungs 3 through 5. If you can’t produce that list in a day, you don’t have a MACD process. You’ve hope.
References
- Telecom Expense Management | RadiusPoint
- What Is Telecom Expense Management? | RadiusPoint
- Outsourced Telecom Expense Management | RadiusPoint
- Telecom Audit Services: What a Line-Item Telecom Audit Actually Finds | RadiusPoint
- Glass manufacturer saves $100K on telecom expenses | RadiusPoint
- About RadiusPoint | RadiusPoint
- Sharon R. Watkins | RadiusPoint
Related articles
- What Is Telecom Expense Management?
- Telecom Audit Services
- Telecom Expense Management
Disclaimer
This article is general information for finance and telecom operations teams. It is not a promise of recovery timing or savings. Outcomes cited are from specific RadiusPoint client engagements in RadiusPoint’s published case studies.

Vacant Cost Recovery: The Utility Bills Nobody Is Watching
By Sharon Watkins, Founder and CEO, RadiusPoint · 3 August 2026 · 12 min read
Vacant cost recovery is the process that finds utility bills still sitting in the owner’s name after a tenant leaves, then assigns the rightful payer. A facilities lead opens the March electric bill for a store that closed in November and the amount has not moved. Vacant cost recovery is a Utility Expense Management (UEM, not Unified Endpoint Management) control that reconciles occupancy, account name, and meter consumption so finance stops paying someone else’s kilowatts. RadiusPoint runs that control on ExpenseLogic, the platform that holds telecom, wireless, and utility invoices in one place.
Key Takeaways
- Vacant cost recovery is a Utility Expense Management (UEM) job: it matches occupancy to the name on the utility account, then recaptures charges the owner should not keep.
- RadiusPoint has published vacant cost recovery work that decreased utility expenses by 12%.
- A RadiusPoint multi-location client paid $1,500 a month, $18,000 a year, for utilities at closed locations.
- The Owner-Name Continuity Test uses four checks: occupancy status, account name, meter use, and the lease rule on who owes after move-out.
- RadiusPoint’s Capterra listing sat at 4.8 from 31 reviews through December 2025, and Amalgam Insights named RadiusPoint a Distinguished Vendor on the 2024 TEM Vendor SmartList.
The Short Version
Vacant cost recovery belongs to finance and facilities together: if the account name still says owner after the unit or site is no longer yours to occupy, RadiusPoint should treat that bill as an exception in ExpenseLogic, not as rent.
In this article
- What vacant cost recovery covers
- Who actually owes the utility bill after a tenant leaves?
- The Owner-Name Continuity Test
- Why do vacant-unit bills keep arriving after move-out?
- Commercial closed-location leakage versus multifamily VCR
- How should finance treat a recovered vacant cost?
- How RadiusPoint and ExpenseLogic execute vacant cost recovery
What vacant cost recovery covers
Vacant cost recovery covers utility charges that stay on the owner’s account after occupancy has changed, across electric, gas, water, sewer, and waste. RadiusPoint treats vacant cost recovery as a named Utility Expense Management (UEM) control inside ExpenseLogic, not as a one-time AP write-off. The live RadiusPoint utility expense management service runs meter-level invoice receipt, tariff checks, and site open-and-close workflows. Vacant cost recovery sits on top of that feed: it asks who should be the billed party for this meter in this period.
Vacant cost recovery is the transfer problem. A utility bill audit is the tariff and consumption problem. They share invoices. They don’t share the question. RadiusPoint keeps both in ExpenseLogic so a facilities lead can see a vacant flag and a rate-class flag on the same meter without mixing the two workstreams.
RadiusPoint has been in expense management since January 1992, and the about page still frames the founding job as telecom, technology, and utility control. Vacant cost recovery is the property-management face of that same job.
Who actually owes the utility bill after a tenant leaves?
The party named on the lease and on the utility account owes the bill after move-out, and those two names often disagree for weeks. RadiusPoint starts vacant cost recovery in ExpenseLogic by putting the rent roll or site-status file next to the utility account header, then asking which name the tariff and the lease actually support. If the lease says the resident places service in their name, a bill that stays in the owner’s name after move-in is the resident’s consumption on the owner’s BAN. If the lease says the owner keeps house service during vacancy, the owner owes the vacant-period usage and should stop paying the day a new resident’s account starts.
Who owes is a document question, not a vibe. RadiusPoint doesn’t invent a payer. ExpenseLogic holds the invoice image, the meter ID, and the occupancy dates so the exception can be posted to a tenant ledger, billed back, or left as owner house cost with a reason code.
State and local utility rules differ on back-billing and on how long a landlord may leave service in the house name. This article is operations, not counsel. RadiusPoint’s job is to show the mismatch with dates attached.
The Owner-Name Continuity Test
The Owner-Name Continuity Test is RadiusPoint’s four-check method that asks whether occupancy, account name, meter use, and lease still describe one payer. ExpenseLogic is where RadiusPoint stores the four inputs so the test can run every billing cycle, not once a year. No ranking multifamily VCR page we reviewed teaches this four-check sequence as a named finance test. That’s the first.
| Check | Source RadiusPoint loads into ExpenseLogic | Pass condition |
|---|---|---|
| Occupancy | Rent roll, PMS export, or real-estate open/close file | Unit or site status is dated |
| Account name | Utility invoice header and BAN | Name matches the party who should hold service |
| Meter use | Meter-level consumption on the same invoice | Usage is plausible for vacant or occupied |
| Lease rule | Lease clause or house-service policy | Recovery path is allowed or owner cost is coded |
A fail on check 2 with a pass on check 1 is classic tenant-transfer leakage. A fail on check 1 with continuing use on check 3 is a closed-site or holdover problem. RadiusPoint writes the fail type onto the ExpenseLogic exception so AP isn’t guessing.
Why do vacant-unit bills keep arriving after move-out?
Vacant-unit bills keep arriving because the utility’s customer of record doesn’t update when the lockbox does, and nobody reconciles the two files. RadiusPoint sees the same three break points in ExpenseLogic: the departing resident closed service early, the incoming resident never opened service, or the utility processed a transfer against the wrong meter.
Continuous-service agreements make the leak quieter. The lights stay on. The invoice stays in the house name. Finance pays it because the due date is real. ExpenseLogic flags the name mismatch before the payment run, which is the difference between a recovery and a donation.
RadiusPoint published a 12% decrease in utility expenses from vacancy cost recovery. That figure is the only vacant-cost percentage in RadiusPoint’s published case studies, and it’s the headline number for this page. Pair it with the closed-location case below when the estate is commercial, not garden-style.
Commercial closed-location leakage versus multifamily VCR
Commercial closed-location leakage is the same owner-name failure as multifamily VCR, except the “tenant” is your own store, plant, or branch. RadiusPoint keeps both patterns in ExpenseLogic because a retailer and a property manager hit the same meter-to-occupancy break. Ranking VCR pages in 2026 are written for apartments. RadiusPoint’s published commercial proof is different.
| Pattern | Who should hold the account | RadiusPoint published proof |
|---|---|---|
| Multifamily tenant transfer | Resident, per lease, after move-in | Vacancy cost recovery decreasing utility expenses by 12% |
| Commercial closed site | Nobody, once the site is dark | $1,500 a month, $18,000 a year, on utilities at closed locations |
| Waste and refuse at closed sites | Owner only while the container is still there | An elevator-company engagement cut monthly waste expenditure 28% |
RadiusPoint also published a client that grew from 170 to 1,200 locations. At that scale, a missed close on 1% of sites isn’t a rounding error. ExpenseLogic’s closed-location billing exception report exists for that reason. ISO 9001 certification, in place at RadiusPoint since September 2002, is how the exception process stays repeatable when the location count moves.
How should finance treat a recovered vacant cost?
Finance should post a recovered vacant cost as a dated credit or tenant charge, never as a silent cut to the utility line. RadiusPoint pushes that posting file out of ExpenseLogic so the general ledger can show recovery, house cost, and in-period usage as three different things. If you net the credit into “utilities” with no reason code, next quarter’s budget looks lucky and the control disappears.
A recovered vacant cost isn’t a tariff win. It’s a payer win. RadiusPoint keeps the two credits separate in ExpenseLogic because a rate reclass and a tenant transfer answer different audit questions. HumanGood, a named RadiusPoint client, has a published 315% ROI case. Use named cases for the program story. Use the 12% and the $18,000 figures for vacant cost recovery itself.
RadiusPoint’s capability statement lists vacant cost recovery under Utility Expense Management. That’s the correct bucket when a controller asks whether this is a TEM project.
How RadiusPoint and ExpenseLogic execute vacant cost recovery
RadiusPoint runs vacant cost recovery as managed Utility Expense Management: ExpenseLogic ingests each utility invoice and analysts work the owner-name exceptions. The platform already collects line-item utility detail and allocates to location, department, and meter number. Vacant cost recovery adds the occupancy match and the recovery path. RadiusPoint can pay the vendor after the exception is cleared so late fees don’t accrue on a bill you’re still arguing.
Invoice auditing services catch category errors. Vacant cost recovery catches the wrong payer on a correct tariff. You want both. You don’t want one page pretending they’re the same.
Sharon Watkins founded RadiusPoint in 1992 after internal-audit work at a bank. The vacant-cost problem is an audit problem with a lockbox attached. ExpenseLogic is the working paper. RadiusPoint is the person who calls the utility.
FAQ
Does vacant cost recovery apply to a master-metered building?
Yes, but the recovery path changes. On a master meter RadiusPoint still runs ExpenseLogic against occupancy and consumption, yet the “account name” check often stays in the owner’s name by design. Recovery then becomes an allocation or RUBS question, not a utility-transfer question. Don’t force a resident-name test onto a meter the utility won’t split.
Can you back-bill a former tenant after the final statement?
Only if the lease and the local utility rules allow it, and only with dates RadiusPoint can attach in ExpenseLogic. The operational job is to produce the meter-level usage for the overlap period. Counsel decides whether that file becomes an invoice. RadiusPoint doesn’t write lease language.
How is vacant cost recovery different from submetering?
Submetering creates a new bill to a resident from a private meter. Vacant cost recovery asks who should have been the customer of record on the utility’s own account. RadiusPoint can support both inside a UEM program. They’re different postings in ExpenseLogic.
Do you need a TEM provider or a UEM provider for vacant cost recovery?
You need Utility Expense Management. TEM won’t see the electric BAN. RadiusPoint is unusual in running TEM, mobility, and UEM on one ExpenseLogic instance, which matters when a closed store still has a circuit and a meter.
What lease language makes recovery enforceable?
Language that states who places service, who holds house account during vacancy, and how overlap days are prorated. RadiusPoint will read that clause against the invoice. Drafting it’s a legal task, not an ExpenseLogic task.
What to do before the next utility cycle
If you can’t name the customer of record on last month’s five largest vacant or closed sites, start there. RadiusPoint will load those invoices into ExpenseLogic and run the Owner-Name Continuity Test with you. Every cycle you skip is another owner-name bill that looks like rent.
References
- ExpenseLogic | RadiusPoint
- Utility Expense Management | RadiusPoint
- About RadiusPoint | RadiusPoint
- RadiusPoint Capability Statement | RadiusPoint
- Sharon R. Watkins | RadiusPoint
- Invoice Auditing Services: What They Cover and How to Choose a Provider | RadiusPoint
- ExpenseLogic reviews | Capterra
Related articles
- Utility Expense Management
- Invoice Auditing Services
- About RadiusPoint
Disclaimer
This article is general information for finance, facilities, and property-operations teams. It is not legal advice on leases, tariffs, or back-billing. Outcomes cited are from specific RadiusPoint client engagements already in RadiusPoint’s published case studies and are not a guarantee of future results.

Utility Rate Optimization: How to Cut Energy Costs Through Tariff Analysis and Rate Reclassification
A 280,000-square-foot manufacturing facility has been billed on the same rate schedule for nine years. The facility commissioned an automation upgrade four years ago that flattened its load profile. Production shifts moved to nights two years ago to take advantage of lower off-peak rates that the operations team assumed they were already capturing. Nobody re-evaluated the tariff. A rate analysis discovers the facility qualifies for a different schedule that would save $94,000 a year. Nine years of overpayment cannot be recovered. The next nine years can.
Utility rate optimization is the discipline of analyzing tariff structures, demand profiles, and contract terms to confirm every account is billed on the lowest-cost rate it qualifies for. Regulated tariffs and ancillary charges can make up 33 to 67 percent of an energy bill, yet utilities rarely advocate for the lowest-cost rate class. This article explains how rate optimization works, the tariff components that drive cost, and why ongoing tariff analysis belongs inside utility expense management rather than as a one-time consulting engagement.
Utility Rate Optimization Defined
Utility rate optimization combines three related activities: rate reclassification (moving an account to a different rate schedule that better matches its load profile), tariff component analysis (reviewing demand charges, energy charges, power factor penalties, and fuel adjustments), and demand management (operational changes that reduce peak kW or shift consumption to off-peak windows). The goal is to align how the utility bills the account with how the facility actually consumes power.
Rate optimization typically saves 5 to 10 percent off the bill. On a $3 million energy spend, that is $150,000 to $300,000 annually. The savings recur every year the optimal tariff stays in place, but rate optimization is not a one-time exercise. Load profiles shift with operational changes, utilities update tariffs, and rate classes that were optimal three years ago may not be optimal today.
| Tariff Component | What It Charges For | Optimization Lever |
|---|---|---|
| Energy charge ($/kWh) | Total kilowatt-hours consumed | Off-peak load shifting, time-of-use rates |
| Demand charge ($/kW) | Highest 15-minute kW reading | Peak shaving, load management, demand response |
| Power factor penalty | Reactive power above tariff threshold | Power factor correction equipment |
| Customer charge | Fixed monthly account fee | Rate class reclassification |
| Fuel adjustment clause | Variable fuel cost pass-through | Hedging, fixed-price supply contracts |
| Ratchet clause | Demand minimum tied to historical peak | Avoid rates with ratchets when possible |
Three Strategies That Drive Rate Optimization Savings
Most rate optimization opportunities fall into three categories. Each requires interval meter data, current tariff details, and a quantitative comparison of cost under alternative rate structures.
Rate reclassification. Utilities offer multiple rate schedules with different pricing components. A facility may be on a general service rate when its load profile qualifies for a primary or industrial rate with lower energy charges. In most service territories, customers can change their rate once per year, but the change requires explicit application.
Time-of-use and demand management. Time-of-use (TOU) rates charge more during on-peak hours and less during off-peak hours. Facilities with flexible operations can shift load to capture the differential. Demand charges, calculated from the highest 15-minute kW reading in a billing period, can be reduced through peak shaving, equipment staggering, or battery storage.
Power factor and ancillary charge correction. Industrial accounts with poor power factor (below 0.9 or 0.95 depending on tariff) incur penalties that capacitor banks can eliminate. Minimum demand charges, ratchet provisions, and standby fees often have alternative rate paths that avoid them entirely.
Why Rate Optimization Belongs Inside Utility Expense Management
Facilities routinely operate on sub-optimal tariffs for years. Utilities rarely proactively notify customers about money-saving alternatives. The same interval data that drives ongoing UEM also drives rate optimization, which means doing rate analysis as a one-time engagement misses recurring opportunities.
The data needed for rate optimization, 12 to 24 months of interval meter data, line-item charge breakdowns, contract terms, and load profile analysis, is the same data utility expense management produces every billing cycle. Treating rate optimization as a separate consulting engagement creates two problems. First, the analysis goes stale within a year as load profiles shift. Second, the savings opportunities that emerge from quarterly load changes never get captured.
Operational changes shift the optimal rate. New equipment, shift changes, automation upgrades, and capacity expansions all change which tariff is best.
Utilities update tariffs. Rate cases happen continuously. New schedules are introduced and existing schedules are revised. The optimal rate today may not exist in the next rate filing.
New sites need analysis from day one. Acquisitions and new locations often default to the rate the prior owner had, which is rarely the optimal rate for new operations.
How RadiusPoint Drives Continuous Utility Rate Optimization
RadiusPoint operates Utility Expense Management as a hybrid service combining the ExpenseLogic platform with managed audit and tariff analysis. The model produces the data needed for rate optimization as a byproduct of normal billing operations, then applies it.
ExpenseLogic ingests utility invoices for electricity, natural gas, water, sewer, and waste, and applies a line-item audit at the meter level. The platform stores tariff schedules, demand readings, and consumption profiles in a centralized dashboard that delivers actionable business intelligence to finance and operations leaders. When a facility’s load profile shifts, the analytics surface the change. When a utility files a new rate schedule, the platform compares the current rate against alternatives.
RadiusPoint vendor evaluation services review tariff terms against current market rates, identify renegotiation and reclassification opportunities, and confirm that billed rates match contracted rates. One elevator company reduced monthly waste expenditure by 28 percent through vendor and contract optimization.
Together, these capabilities transform expense management from a chore into a strategic advantage. Rate optimization moves from a one-time engagement to a continuous workflow. Savings compound year over year instead of decaying.
The Cost of Operating on the Wrong Rate
Every facility on a sub-optimal tariff is paying a tax measured in tens or hundreds of thousands of dollars annually. Utilities collect the tax quietly. The fix requires interval data, tariff expertise, and a process to revisit the analysis as conditions change. Continuous rate optimization captures the savings; one-time analysis loses them within a year.
| Rate Optimization Approach | Year 1 Savings | Recurring Capture |
|---|---|---|
| No formal analysis | $0 | $0 over 5 years |
| One-time consulting engagement | 5-10% of energy spend | Decays as load profile shifts |
| Continuous UEM-driven optimization | 5-10% of energy spend | Compounds over 5+ years |
Move from scattered data to strategic savings. Schedule a utility rate optimization assessment to quantify the savings hidden in your current tariff structures and the recovery potential in your interval data.

Controlling Period Expenses to Protect Your Profit Margins
A regional healthcare provider operates a network of twenty clinics. Every month, the finance department processes hundreds of invoices for telecom services, IT infrastructure, and utilities. Because these are classified as period expenses, they are immediately deducted from the company’s monthly revenue.
However, a deep dive reveals that the provider is paying for high-speed data circuits at three clinics that closed six months ago. These unnecessary period expenses have been silently eroding the organization’s net income month after month.
Organizations managing multi-location operations frequently struggle with controlling their period expenses. Unlike product costs that can be capitalized and deferred, period expenses hit the income statement immediately.
When utility bills, telecom infrastructure, and software licenses are not rigorously managed, they create a constant, unavoidable drain on profitability. Transforming these scattered expenses into strategic savings is essential for maintaining a healthy bottom line.
The Immediate Impact of Period Expenses
In financial accounting, a period expense is any cost incurred during a specific accounting period that is not directly tied to the production of goods or services. Also known as operating expenses or SG&A (Selling, General, and Administrative) expenses, these costs must be recognized on the income statement in the exact period they occur.
This immediate recognition is what makes period expenses so critical to manage. They cannot be capitalized on the balance sheet or tied to inventory.
| Expense Category | Definition | Impact on Expense Management |
|---|---|---|
| Product Costs | Direct costs tied to creating a product | Can be capitalized and deferred until sale |
| Period Expenses | Operating costs incurred during a timeframe | Immediately reduces net income for that period |
| Fixed Period Expenses | Costs that remain constant regardless of activity | Includes facility rent and base telecom contracts |
| Variable Period Expenses | Costs that fluctuate with business activity | Includes usage-based utilities and variable data plans |
For most organizations, utility bills, telecom services, and IT asset maintenance fall squarely into the category of period expenses. Whether a facility is operating at maximum capacity or sitting completely vacant, the utility and telecom period expenses continue to hit the income statement every single month.
The Financial Drain of Unmanaged Operating Costs
Organizations that fail to track period expenses accurately experience significant resource drain and financial leakage. Vendor complexity across dozens of providers makes it nearly impossible to maintain multi-location visibility using manual spreadsheets.
When utility and telecom expenses are not continuously monitored, several critical issues emerge. Ghost devices and ex-employee lines continue to generate charges, creating period expenses that provide zero value to the organization. Utility providers may apply incorrect tariffs or fail to register disconnected services.
The financial consequences are substantial. Organizations often overpay by 15 to 30 percent on their telecom and utility expenses due to undetected billing errors. For a mid-market company spending $100,000 monthly on these services, unmanaged period expenses could represent up to $30,000 in lost capital every month. This capital could otherwise be deployed for strategic growth initiatives.
Strategies for Optimizing Period Expenses
To optimize expenses and eliminate waste, organizations must implement a structured approach to tracking and controlling period costs. This involves several critical components that work together to provide comprehensive financial control.
Automate Invoice Processing
Manual data entry is prone to human error and consumes valuable staff hours. Automated invoice receipt and processing ensure that period expenses are captured accurately and immediately. This eliminates the delay in identifying cost spikes and frees up personnel for higher-value tasks.
Track Costs with Precision
Effective expense management requires granular data. Costs must be allocated down to the specific meter number, phone number, or Employee ID. This level of detail allows finance teams to pinpoint exactly which department or location is generating unnecessary period expenses, rather than dealing with vague, aggregated totals.
Validate Every Line Item
A one-time audit is insufficient for long-term cost control. Continuous line-item audits verify that vendors are billing according to contracted rates. Service validation ensures that the organization is only paying for active, necessary services. This proactive approach identifies errors before they compound over multiple billing cycles.
Eliminating Period Expenses from Vacant Properties
One of the most challenging areas of period expense management involves utility bills for property portfolios. When tenants vacate a unit, or a corporate facility sits empty, it generates zero revenue. However, the property owner often continues to absorb the utility bills as a period expense.
These vacant properties create a massive financial drain. Without a centralized system to track occupancy status alongside utility billing, organizations pay for electricity, water, and gas for empty spaces. These unnecessary period expenses directly reduce the organization’s net income.
This is where specialized expense management solutions become critical. By integrating cost data with occupancy metrics, organizations can identify which vacant units are generating unnecessary period expenses. This visibility allows property managers to take immediate action, either by transferring the billing responsibility or disputing incorrect charges with the utility provider.
Transform Scattered Data into Strategic Savings
RadiusPoint provides the technology and expertise necessary to transform scattered data into strategic savings. Through the proprietary ExpenseLogic platform, organizations gain a unified solution for Telecom Expense Management, Managed Mobility Services, and Utility Expense Management.
ExpenseLogic automates the tracking of period expenses, instantly flagging billing errors and unauthorized charges for review. The platform performs line-item audits to identify zero-use devices and unused telecom lines. This level of scrutiny allows RadiusPoint to secure refunds and eliminate unnecessary operating costs.
For property management organizations dealing with utility period expenses on vacant units, RadiusPoint offers a specialized approach. The platform tracks utility expenses down to the meter level. When charges occur on a vacant property, the managed services team investigates the discrepancy.
Organizations utilizing ExpenseLogic experience an average cost reduction of over 30 percent in the first year. The platform delivers actionable business intelligence, allowing finance directors to achieve an average return on investment ranging from 370 to over 580 percent. By combining cloud-based software with a dedicated team of auditors, RadiusPoint ensures that period expense management leads directly to cost recovery.
Organizations managing multi-location operations face a critical decision. They can continue to absorb the financial leakage caused by undetected billing errors and vacant property charges. Or, they can implement a comprehensive expense management solution to gain total visibility and control over their period expenses.
To eliminate waste and optimize your utility spending, explore the Vacant Cost Recovery solution and discover how RadiusPoint can turn your expense management into a strategic advantage.